The whole planet, live, in one browser tab.

Every satellite. 10,000+ aircraft. Lightning as it strikes, earthquakes as they land, the wind, the swell, the buses in Bristol and the rivers in Yorkshire. 27 layers on one 3D globe, drawn by your own graphics card. And now you can just ask it.

£0 no account · no app · no ads

Free forever. Explorer watches your places and tells you when something happens – £36 a year, or try it free for 7 days, no card.

Episode 1 · Is the Earth flat?
Ask the Planet: liveOwn ADS-B receiverRaspberry Pi ingestHand-written WebGPU60+ live feeds
10,025aircraft in one snapshot
608ships in the northern Baltic
189earthquakes in the last 24 hours
45,294fire detections from orbit
3,786buses and London trains
437road disruptions in England
3,479river gauges reporting
10,435air-quality sites worldwide

READ FROM THE LIVE SITE · 16 NOV 2026 · ABOUT 00:15 UTC · COUNTS CHANGE MINUTE BY MINUTE

LIVE NOW

Ask the Planet.

Press Ask the Planet, type a question in plain English, and it goes off and reads the same feeds the globe draws from. It flies the camera, switches on the layers it needs, sets the clock back if it has to, and every figure in the answer comes with its source and the time it's from. If the data isn't there it says so. It doesn't guess.

01

It reads our data, not the internet. It gets tools for the layers on the globe, plus a short allow-list of sources for history: USGS earthquakes, NASA FIRMS fires, weather-station records from Meteostat, the Environment Agency's river archive, space weather from NOAA and GFZ, the satellite catalogue and Wikidata.

02

It drives the globe. Fly here, follow that plane, ring the quakes it's talking about, wind the clock back six hours. You see the answer as well as read it.

03

It shows its working. Every answer lists its sources and their licences, a "Before you rely on this" box when the data is partial or late, and a "How this was worked out" log of every call it made and every file it read. Charts draw right in the chat.

04

Free, no account. A Cloudflare check instead of a login, a daily allowance shown under the box, and no tracking cookies. Your question goes to Anthropic's Claude to be answered and Ask the Earth keeps nothing once it's done. Your location only goes with it if you press Use my location. Like an answer? Share it as a link.

ASK THE PLANETLIVE SITE · 4 NOV 2026 · 21:45 UTC
Is it an El Niño year, and how does it compare with 1997?
Yes. NOAA's Climate Prediction Center has an El Niño Advisory in force, issued 8 October 2026. It says El Niño "continues to strengthen", with a strong-to-very strong event likely through January to March 2027 (greater than an 83% chance).

Compared with 1997:
· The latest Oceanic Niño Index (ONI) value is 2.46 for August to October 2026. That is the sea-surface anomaly in the central Pacific, in °C.
· The 1997–98 peak was 2.37 for November 1997 to January 1998. So the current season is already slightly warmer than that event's peak.
· The strongest peak in the record shown is 2.59, for November 2015 to January 2016. The 2026 season sits between that and 1997–98.
· The weekly Niño 3.4 anomaly was 3.4 °C for the week of 28 October 2026, up from 2.6 °C in mid-August.
SOURCE: NOAA CPCBEFORE YOU RELY ON THIS: TROPICAL PACIFIC ONLYHOW THIS WAS WORKED OUTSHARE
A REAL ANSWER FROM THE LIVE SITE, QUOTED AS IT CAME BACK AND TRIMMED AT ITS SOURCES LINE. WE CHECKED EVERY FIGURE AGAINST NOAA'S OWN FILES.
Things to ask it
Space + skyWhen can I next see the ISS from Bristol?Works out the passes for that place and keeps the ones where the station's in sunlight and you're in the dark.
Rivers + rainAre any rivers in Yorkshire high right now, and is more rain coming?Reads the gauges and the flood warnings, then the rain forecast for the same spot.
Quakes + chartChart this week's earthquakes over magnitude 5.Pulls the events from USGS, draws the chart in the chat and rings each one on the globe.
HistoryHow much rain fell in Exeter last week?Reads the nearest weather station's daily record and adds it up.
SurfIs Fistral any good tomorrow morning, and is anything spilling nearby?Reads the spot's stars and swell, then the sewage overflows linked to it.
AirIs the air bad in London today?Checks the official stations and the UK forecast, and answers with the index and the UKHSA's advice.
PlanesWhat's the highest plane over the Channel right now? Follow it.Searches the live aircraft, picks it out and locks the camera on.
AuroraAny chance of seeing the aurora from Scotland tonight?Reads the Kp index and the aurora forecast, then the cloud.
Explorer alerts

It watches your places.

Save a place, pick what you care about, and your phone gets a ping when it happens. Nothing older than an hour, never the same thing twice.

AlertWhen it firesWhere it works
Aurora likelyWhen the chance of seeing it here reaches your level, and only after dark.Everywhere
Quake nearbyA quake this big or bigger, this close.Everywhere
Satellite passA bright satellite you can see, 10 minutes before it rises.Everywhere
Lightning nearbyA strike this close. One alert every 3 hours at most.The Americas, Europe and Africa
Flood warningA flood alert or warning for an area that covers the place.England, Wales and Scotland
Power cutA power cut reported for the area around the place.Great Britain
Low-carbon electricityThe greenest electricity of the day in your region. Once a day at most.Great Britain
Bathing waterA sewage spill or a poor water notice at a bathing site within 5 km.England
Good surf windowThe nearest forecast spot rated good or better in the next day.The Cornish beaches

Read from the alert settings in the app itself, so it can't say more than the app does.

On iPhone, add the site to your Home Screen first – that's the only way Safari allows notifications.

If your place is somewhere a type has no data, the app greys it out and tells you why. Try a flood alert for Madrid and see.

Try Explorer free for 7 days No card. It just stops.
What's on the globe

27 layers. 60+ data sources. One place.

Normally you'd need a flight tracker, a ship tracker, a weather app, a surf app, a satellite site and a council website or two. Here it's all one switch away, and it all runs on the same clock, so you can watch a storm roll in, rewind it and see the lightning again.

Space and sky

SatellitesEVERY 2 H

All 16,894 active payloads, from the ISS to every Starlink, propagated on the GPU every frame. Tap one to follow it round the planet.

CelesTrak · US Space Force 18 SDS
Space debrisEVERY 2 H

10,239 pieces of debris and 2,167 spent rocket bodies, each drawn in its own style.

CelesTrak
Aurora5 MIN

The OVATION forecast as a glow on the night side, with the live Kp index.

NOAA Space Weather Prediction Center
Stars and constellationsSTATIC

8,920 stars down to magnitude 6.5, precessed to the date, and all 88 constellations plus the famous asterisms.

HYG v4.4 · d3-celestial · Astronomy Engine
Earth in motion

Earthquakes1 MIN

The last 24 hours, sized by magnitude. New ones pulse as they arrive.

USGS
Lightning1 MIN

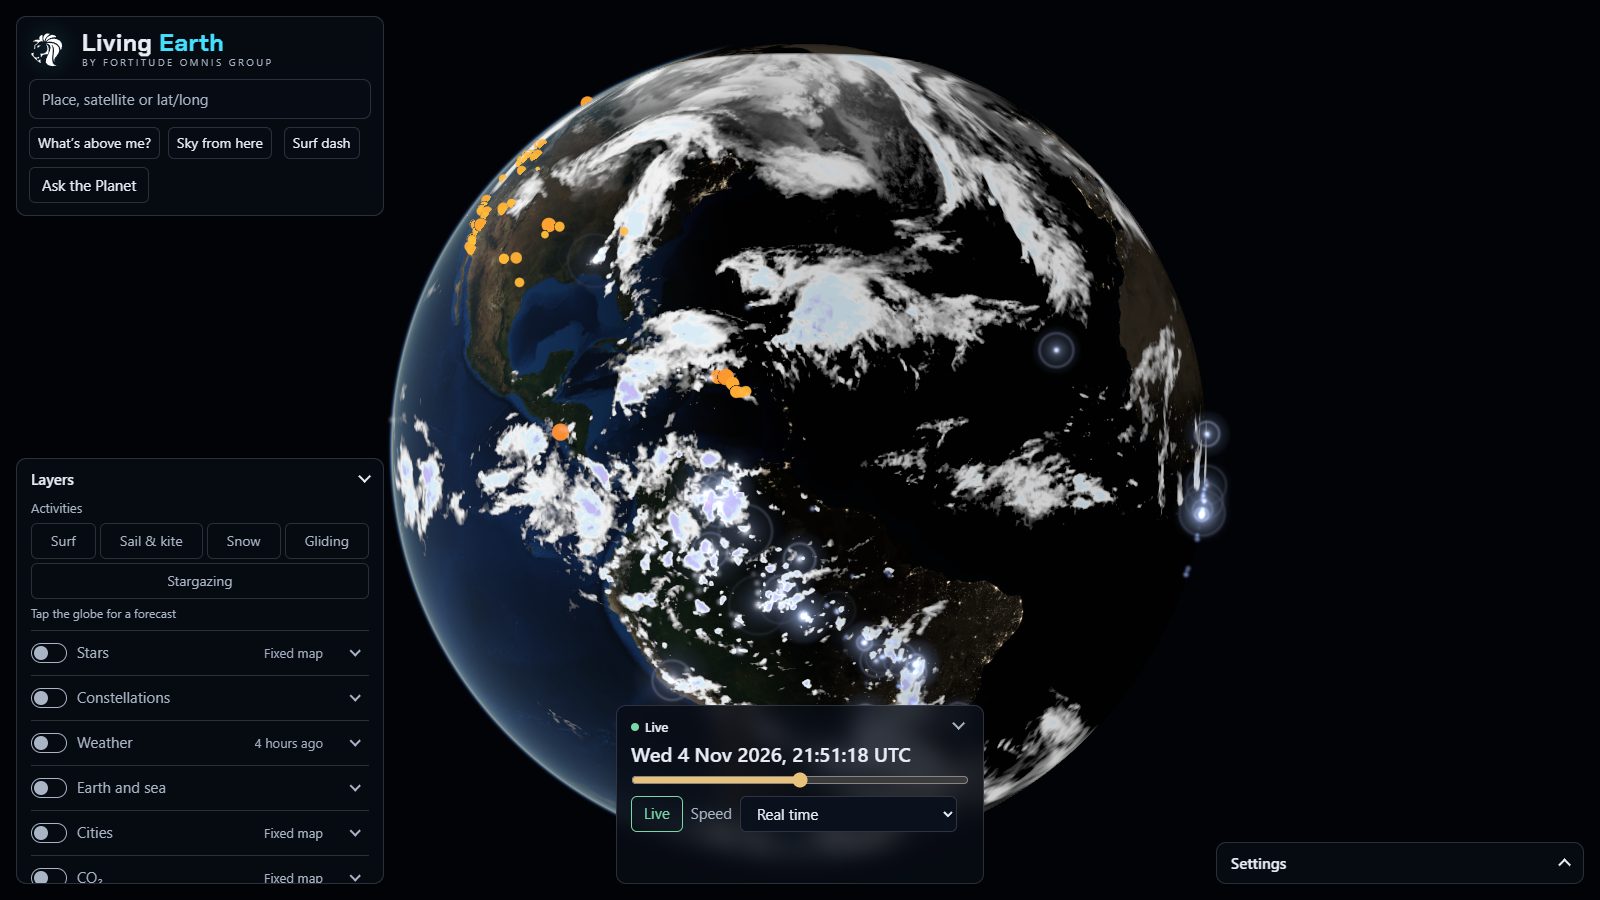
Every flash blooms white-blue then fades. The Americas from GOES, Europe and Africa from Meteosat's new Lightning Imager.

NOAA GOES GLM · EUMETSAT MTG LI
Satellite clouds10 MIN

The hourly infrared mosaic from the GOES, Meteosat and Himawari weather satellites. Works the same at night as by day.

NOAA/NESDIS GMGSI
WildfiresEVERY 2 H

Every hotspot the VIIRS instruments pick up from orbit, with 48 hours of history for rewind.

NASA FIRMS VIIRS

Weather and sea

Weather, 18 mapsEVERY GFS RUN

Wind, temperature, rain and snow, gusts, pressure with isobars, CAPE, humidity, feels-like, snow depth, freezing level and more. 41 frames out to 5 days, with up to 65,536 wind particles flowing over the top.

NOAA GFS and GFS-Wave
Waves, swell and currentsHOURLY

Two swell trains, wind sea and sea temperature, plus ocean currents drawn as streaks at 0.25°.

NOAA GFS-Wave · NOAA Global RTOFS
Surf, 36 Cornish spots4× DAILY

Star ratings, tide, a five-day outlook, the nearest live wave buoy and bathing-water warnings for every spot.

Met Office NWS model via Copernicus Marine · CCO buoys · EA
Air quality and UV10–60 MIN

Official UK stations with the Daily Air Quality Index and a 5-day forecast, 11,000+ world stations, citizen sensors, and PM2.5, dust, smoke and UV maps.

Defra UK-AIR · OpenAQ · Sensor.Community · CAMS · UKHSA

Things that move

Aircraft30 S

Every plane the network can hear, turned to its track and coloured by height. Tap one for its route, its progress and the line it has flown. Fed in part by our own ADS-B radio receiver.

Own 1090 MHz receiver · adsb.lol (ODbL) · VRS standing-data
Buses and trains30 S

Every bus in England that's reported in, plus every Underground, Overground, DLR, Elizabeth line and tram train in London, gliding between real reports.

DfT Bus Open Data · TfL Unified API
Roads5 MIN

Closures and disruptions on England's motorways and major A-roads, and across London.

National Highways · TfL
Ships1 MIN

Live AIS for Finnish and northern Baltic waters, ships turned to their heading and coloured by type.

Fintraffic Digitraffic (CC BY 4.0)
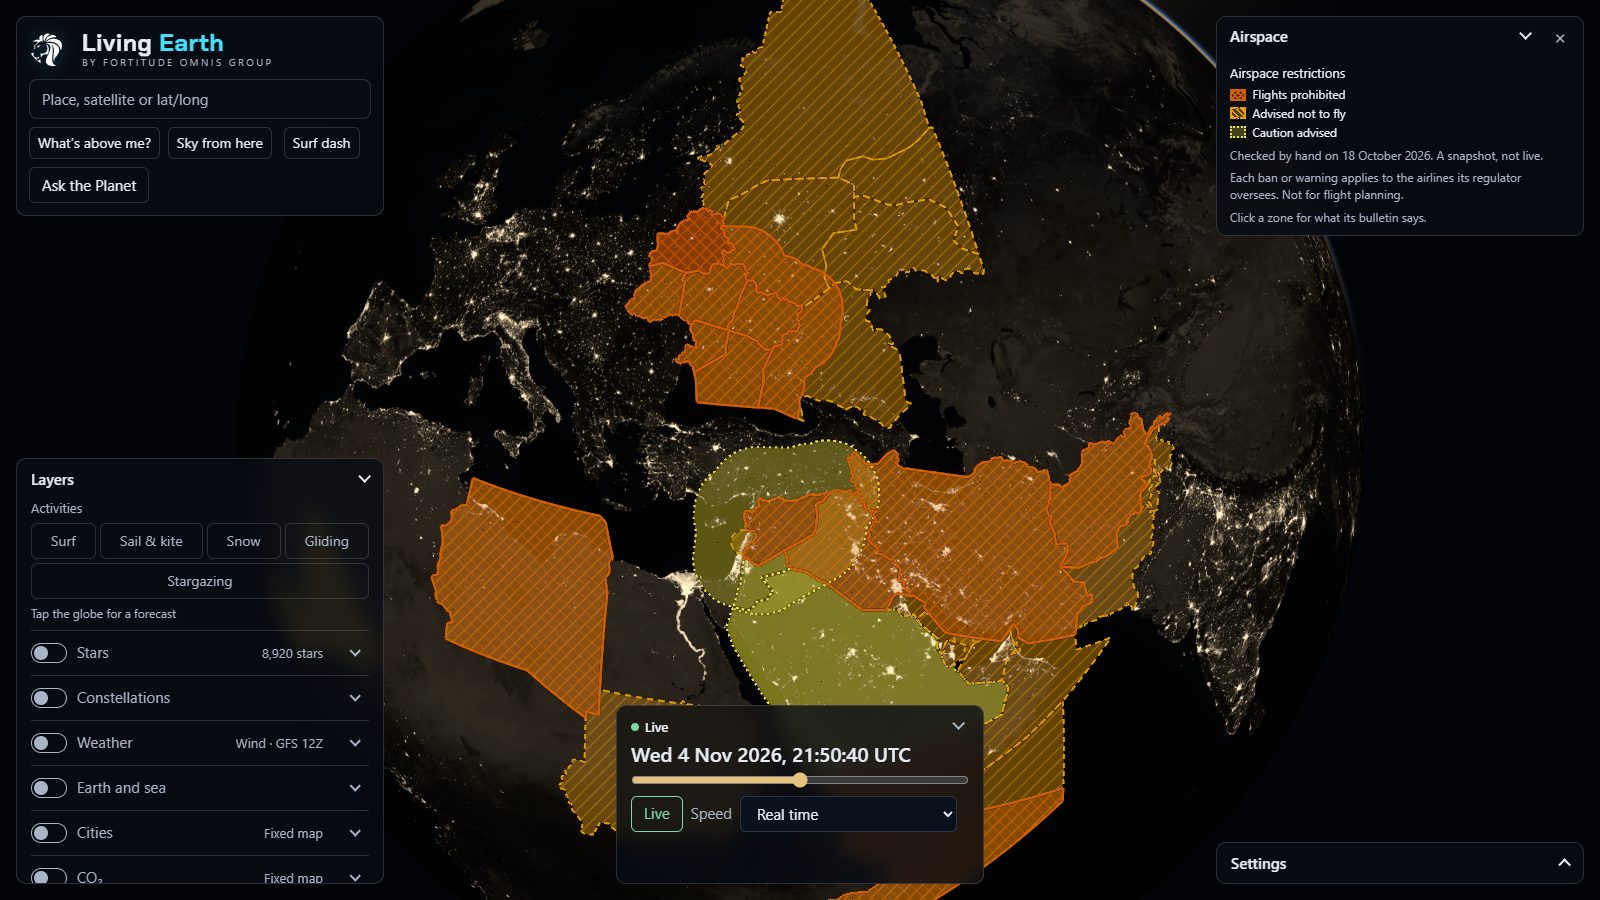
Airspace restrictionsCURATED

33 conflict-zone warnings and bans, shaded on the map.

EASA · FAA · VATSpy

Britain, up close

Water15 MIN

Every river in England and Scotland coloured by its nearest gauge, from low to very high. Flood warnings for England, tide and surge at 43 tide gauges, and 464 bathing waters.

Environment Agency · SEPA · OS Open Rivers · TICON-3
CitiesDAILY / WEEKLY

Population to census detail, modelled road and rail noise, street crime, and every public EV charger worldwide.

ONS · GHS-POP · Defra · data.police.uk · Open Charge Map
British Isles in 19 m detail2025 Q3

Our own bake of the Copernicus Sentinel-2 mosaic: 14,214 tiles for close-ups of home, on top of 9.5 m cloudless imagery for the world.

Copernicus Sentinel-2 · EOX

Reference

202,357 place namesSTATIC

From countries down to villages over 14 zoom levels, thinned so two names never overlap.

Natural Earth · GeoNames · OS Open Names
Borders, time zones, gridSTATIC

81,850 points of coast and border, live clocks per time zone, and a lat-long grid with the tropics in gold.

Natural Earth 1:50m · timezone-boundary-builder
Day and night EarthMONTHLY

Twelve monthly Blue Marble textures at up to 8192 × 4096, so the snow line moves with the seasons, and NASA's Black Marble city lights after dark.

NASA Blue Marble NG · NASA Black Marble
Time travelRewind 24 hours, or fast-forward up to 5 days of forecast, at up to an hour a second.
What's above me?Everything over your head right now, tonight's sky and visible ISS passes. Your location never leaves the device.
Sky from hereLong-press anywhere to stand on the ground and look up, with a compass and the constellations.
Five activitiesSurf, sail and kite, snow, gliding and stargazing presets, each with a 5-day card, a confidence rating and what to wear.
Hear the planetQuakes ring as bells, lightning crackles, the aurora hums. All synthesised live, with captions.
Every feature by keyboardTested end to end, plus reduced motion, screen-reader captions and a phone layout.
Panel by panel

13 panels. Every switch, every key, every card.

Switch a layer on and its panel docks at the side of the screen, with its own switches, keys and notes. Then everything it draws (a dot, a river, a region, a box in the Pacific) opens a card when you tap it. Here's what's in each one. Every crop below is the live site on the night of 4 November 2026, real data and all.

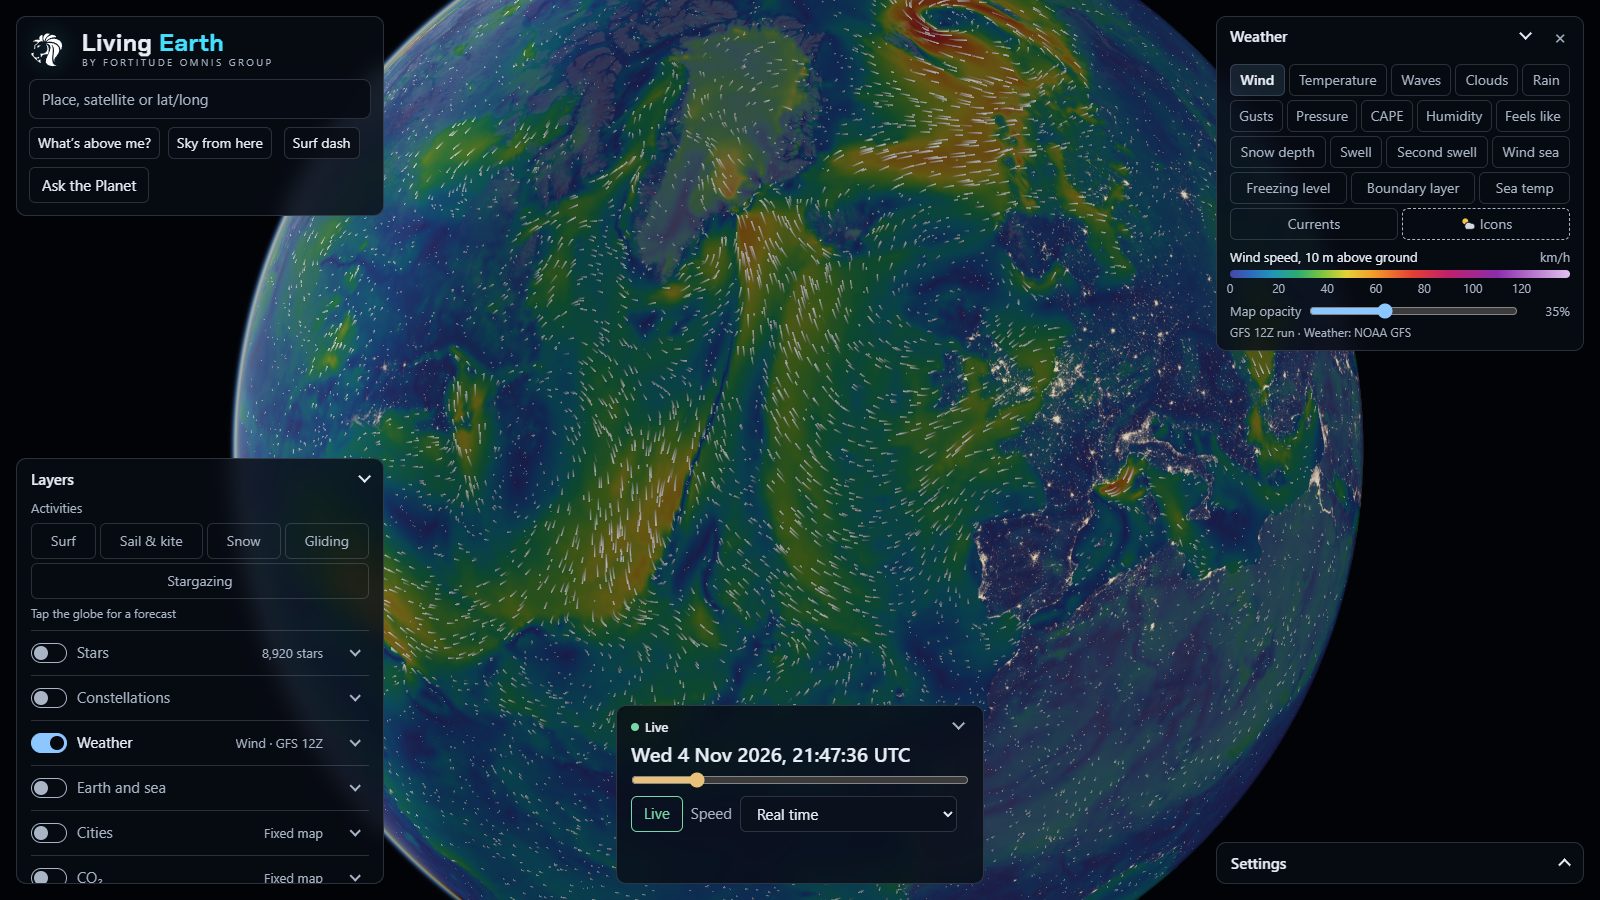
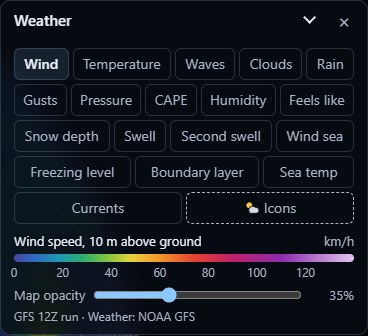
The Weather panel: 18 map buttons from Wind to Currents, an Icons switch, a wind-speed scale from 0 to 120 km/h, a map opacity slider and the GFS 12Z run credit
WEATHER · WIND MAP · GFS 12Z RUN

Weather

EVERY GFS RUN

One forecast map over the whole planet at a time, picked from 18, with its colour scale, an opacity slider and the model run it came from. Scrub the time bar and the map plays forward five days.

18 mapsWind, Temperature, Waves, Clouds, Rain (with snow), Gusts, Pressure, CAPE, Humidity, Feels like, Snow depth, Swell, Second swell, Wind sea, Freezing level, Boundary layer, Sea temp, Currents.
Moving, not paintedWind and gusts flow as streaks, waves and swells as ripples, and pressure gets isobars. The sea maps are cut to the OpenStreetMap coastline.
Icons switchForecast symbols at up to 60 towns for the time on the slider, a moon after dark, more towns as you zoom in.
41 framesNOAA GFS at 0.5°, 0 to 120 hours in 3-hour steps, checked every hour for a new run. Currents come from NOAA's RTOFS at 0.25°.
Tap anywhereThe 5-day forecast card for exactly that spot, land or sea. There's a whole section on it further down.
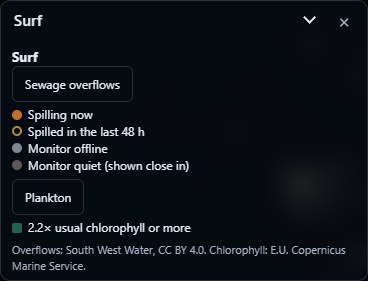
The Surf panel with two switches, Sewage overflows with a four-colour key from spilling now to monitor quiet, and Plankton at 2.2 times the usual chlorophyll or more
SURF · SEWAGE AND PLANKTON SWITCHES

Surf

4× DAILY

36 Cornish spots on the globe, from Sandymouth and Crooklets down round Sennen to Porthleven and Whitsand Bay, each one a ★ rating you can tap. Crowded stretches fold into a +N badge that opens a picker. The spot list was checked by a Cornish surfer.

Sewage overflows417 of South West Water's storm overflows: spilling now, spilled in the last 48 hours, monitor offline, monitor quiet.
PlanktonSatellite chlorophyll at 2.2× the usual for the month and the spot, or more, shown as a green tint off the coast.
Published methodExposure, refraction, the Komar and Gaughan breaker height, wind class and a tide band. The working is in the code for anyone to check.
Tap a spot0 to 5 stars (faded ones show what the wind and tide took away), the surf height as a range, primary and secondary swell and wind sea with period and direction, the wind, the tide rising or falling, and the best wind and tide for that spot. Then the nearest of 7 live wave buoys, the sea temperature against normal, a tide chart predicted from 40 constituents, the next five days, and a line each for bathing water, sewage and plankton.
Met Office NWS model via Copernicus Marine · GFS · CCO buoys · TICON-3 · South West Water · EA
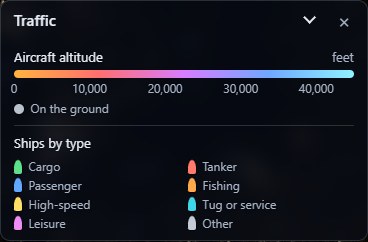
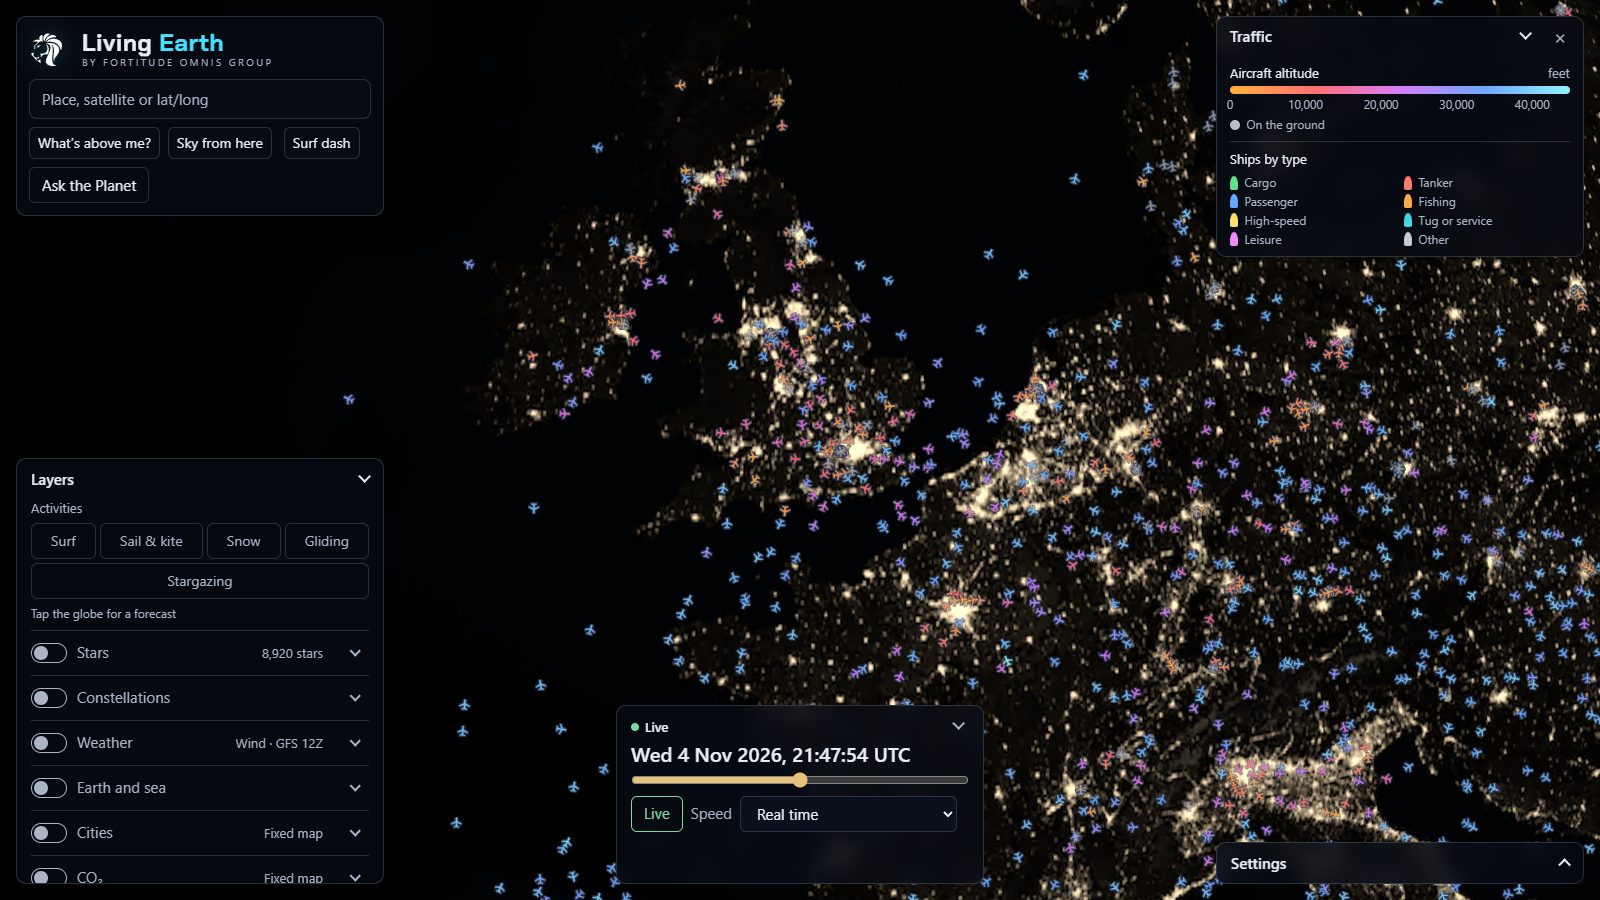
The Traffic key: aircraft altitude in feet from the ground to 40,000 ft, and ships by type in eight colours
TRAFFIC · AIRCRAFT AND SHIPS KEY

Traffic

30 S · 60 S

Aircraft coloured by height, from amber on the ground to pale cyan at 45,000 ft, and ships by type. 11,529 planes and 615 ships when we took this.

8 kinds of shipCargoTankerPassengerFishingHigh-speedTugLeisureOther
Flown track and routeTap a plane and it draws the line it has flown, coloured by height, and the great-circle route ahead, dashed. 620,874 routes from VRS standing-data.
Follow and findFollow any plane, ship, bus or train and the camera rides along. Find a flight by its number.
Tap a planeCallsign, registration, the type in words (about 160 of them, so A20N reads Airbus A320neo), altitude in metres and feet, speed in km/h and knots, the route with any stops, progress (62% · 1,240 km to go · about 1 h 35 min), track, squawk, ICAO address and the last report.
Tap a shipType, destination, speed, course, heading, its AIS status (under way, at anchor, moored, aground) and MMSI. Ships cover Finnish and northern Baltic waters only, for now.
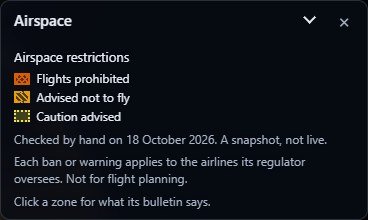
The Airspace restrictions panel with three severities, flights prohibited, advised not to fly and caution advised, checked by hand on 18 October 2026
AIRSPACE RESTRICTIONS · SNAPSHOT 18 OCT

Airspace

CHECKED BY HAND

33 conflict zones, each with its own hatching: 13 where flights are prohibited, 14 where airlines are advised not to fly, and 6 where caution is advised. 17 come from EASA and 16 from the FAA. It says plainly that it's a snapshot and not for flight planning.

Click a zoneEvery zone overlapping that spot, worst first: who issued it, its reference, when it was issued and until when, the flight levels it covers, the regulator's own summary and a link to the bulletin.
EASA Conflict Zone Information Bulletins · FAA SFARs and NOTAMs · VATSpy
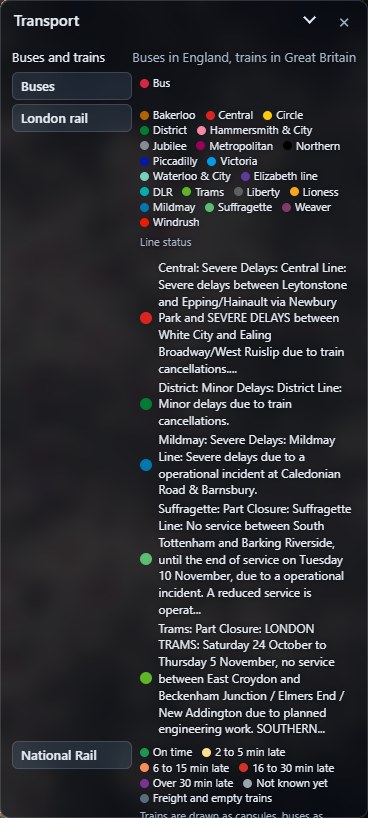
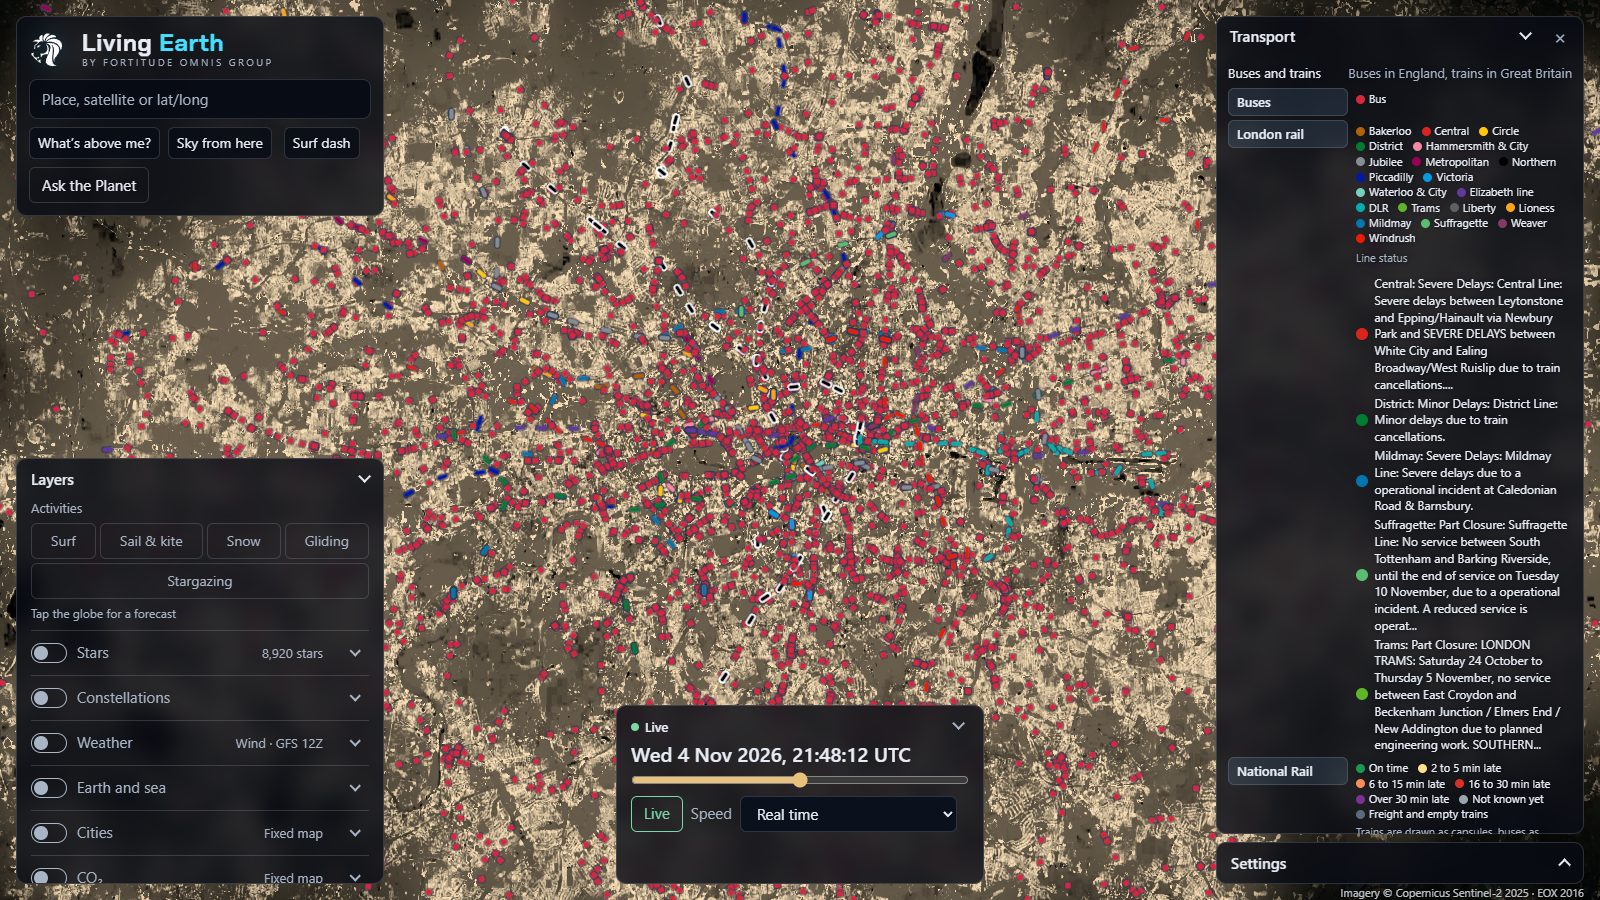
The Transport panel: Buses, London rail with all 20 lines in TfL colours and the live line status, and the National Rail lateness key
TRANSPORT · LONDON LINE STATUS, LIVE

Buses and trains

30 S

Every bus in England that reports in, and every Underground, Overground, DLR, Elizabeth line and tram train in London. They're shown 90 seconds behind live on purpose, so they glide between real reports instead of jumping. 9,279 of them on the map that night.

BusesEvery operator in England, from the Department for Transport's Bus Open Data Service.
London rail20 lines in TfL's own colours, plus the line status in TfL's own words. Severe delays on the Central that night, and the Suffragette part-closed.
National RailBuilt, with a six-band lateness key from on time to over 30 minutes late. Not switched on yet.
Tap a bus or trainA bus gives its route and destination, operator, fleet number, how full it is if the operator says, and its last report. A tube gives its line and destination, where it is ("between Pimlico and Vauxhall"), the next stop and its train number.
DfT Bus Open Data · TfL Unified API
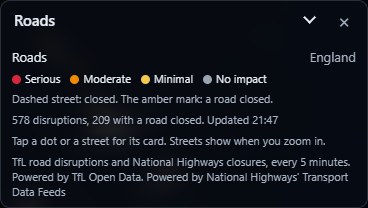
The Roads panel with four severities, serious, moderate, minimal and no impact, and a live count of disruptions and road closures
ROADS · LIVE COUNT

Roads

5 MIN

Disruptions across London and closures on England's motorways and major A-roads, 582 of them on the night, with a live count of how many have the road shut. A dot per disruption from far out, and the affected streets drawn in as you zoom, closed ones dashed.

Tap a dot or a streetThe category and title, the exact place ("[A3] Wandsworth High Street"), its severity, from and until in UK time, whether the road's closed, and the latest update in the operator's words.
TfL road disruptions · National Highways closures
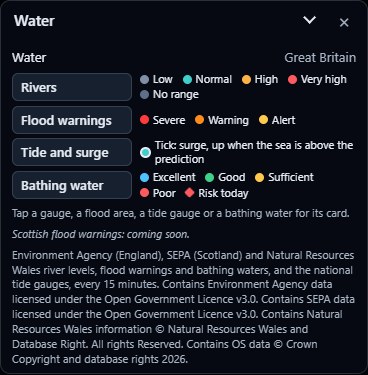
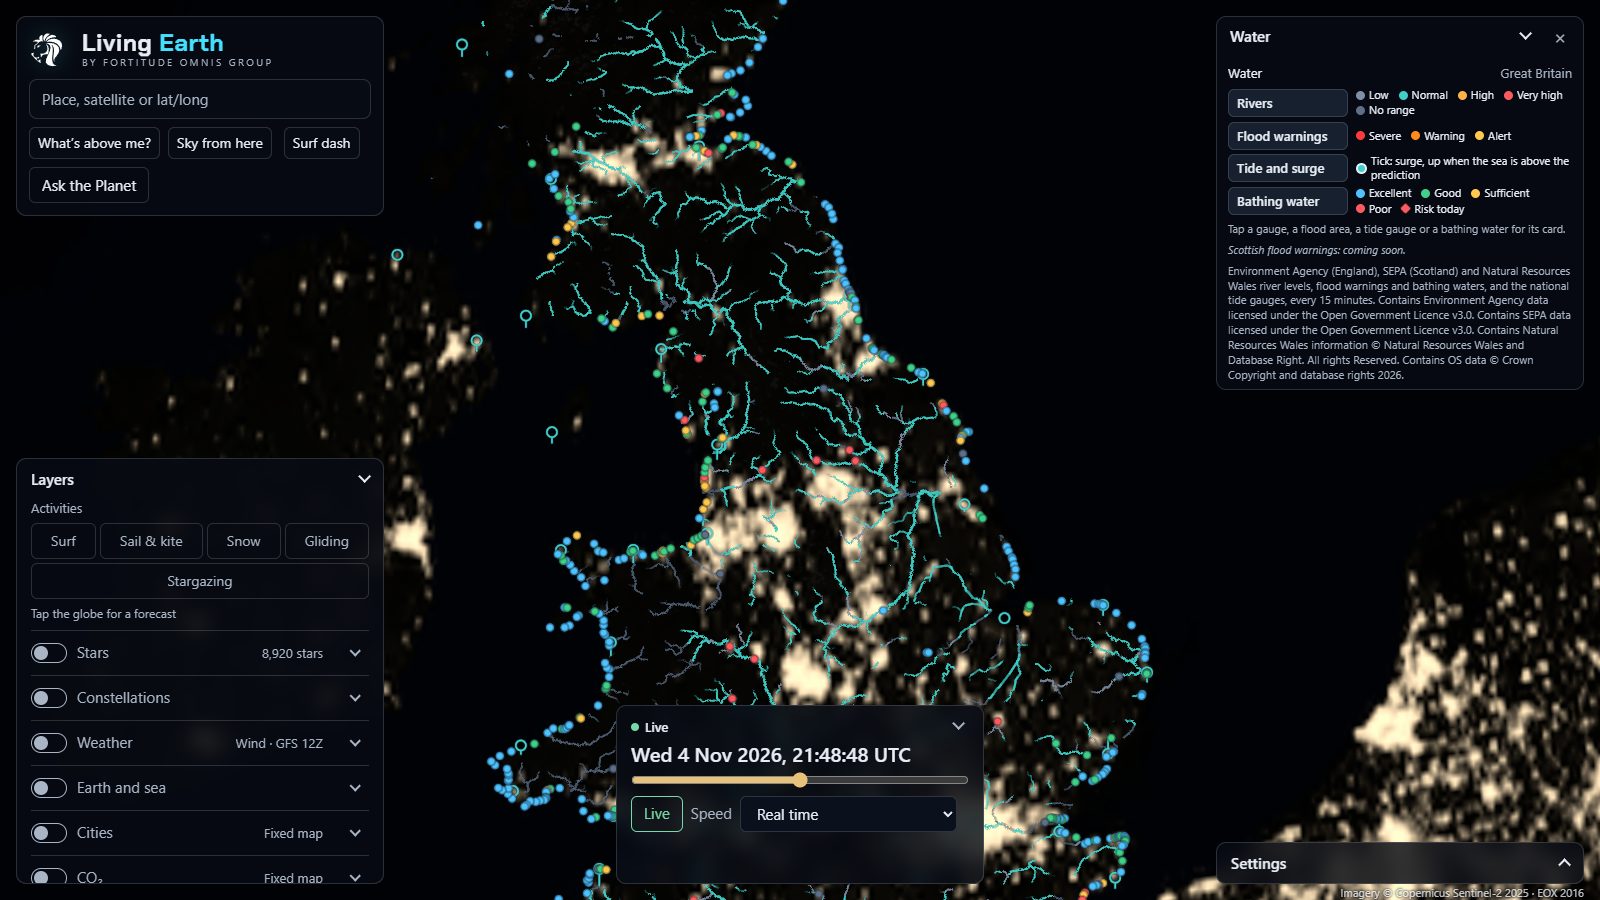
The Water panel with four switches, Rivers, Flood warnings, Tide and surge and Bathing water, each with its colour key
WATER · FOUR SWITCHES

Water

15 MIN

3,704 river gauges (3,310 from the Environment Agency and 394 from SEPA in Scotland) colour 158,087 stretches of river. On top go 761 flood areas, 43 tide gauges and 464 bathing waters.

RiversLow, normal, high or very high against each gauge's own usual range. Late readings go grey.
Flood warningsSevere, warning and alert, for England. Scotland's are coming.
Tide and surgeA ring per tide gauge, with a tick pointing up when the sea's higher than predicted.
Bathing waterExcellent to poor, plus a pollution-risk mark on the day in season.
Tap a gauge, area or beachA river gauge gives its level now, its usual range, the highest recent, any warnings and the last 5 days as a chart. A flood warning gives the agency's own message and the gauges nearby. A tide gauge gives the surge now and today's tide curve. A bathing water gives its grade, the latest E. coli and enterococci counts and today's pollution risk.
Environment Agency · SEPA · OS Open Rivers · TICON-3
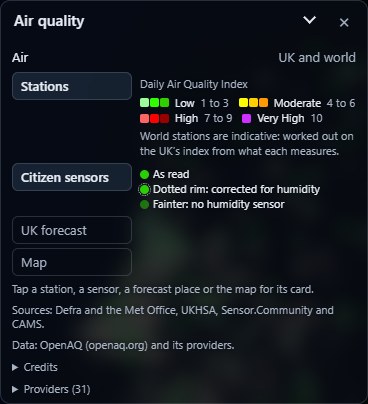
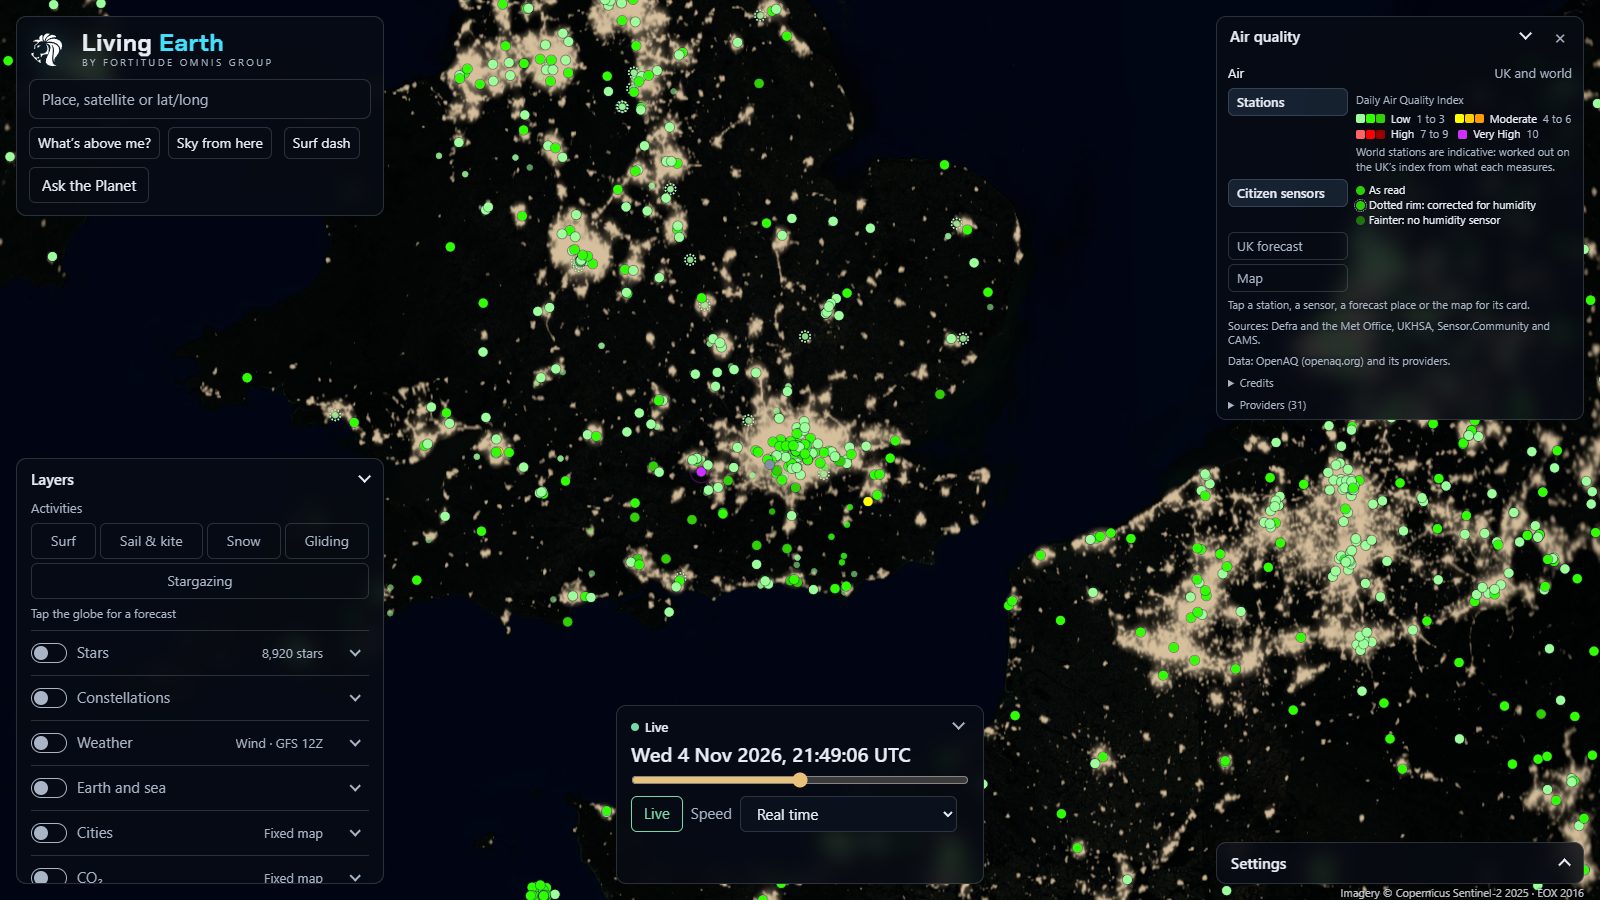
The Air panel with Stations, Citizen sensors, UK forecast and Map switches and the Daily Air Quality Index colours from low to very high
AIR · UK AND WORLD

Air quality

10–60 MIN

11,220 sites, all on the UK's 1 to 10 Daily Air Quality Index so you can compare them. Anything at 7 or above pulses.

Stations209 official Defra sites in the UK, and about 11,000 world stations from 1,539 OpenAQ providers.
Citizen sensorsSensor.Community PM sensors across Britain and Ireland, corrected for humidity where they can be.
UK forecast5,886 places, five days each, following the time bar.
MapPM2.5, dust, smoke or the UV index over the whole planet, five days ahead.
Tap a dot or the mapA UK station gives its index, each pollutant with Defra's own averaging, and health advice worded by the UKHSA, for everyone and for people with lung or heart conditions. A forecast place gives five day tiles. The map gives the value at that spot and a 5-day hourly chart.
Defra UK-AIR · UKHSA · OpenAQ · Sensor.Community · CAMS
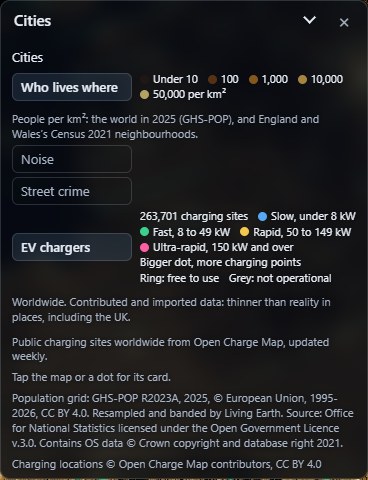
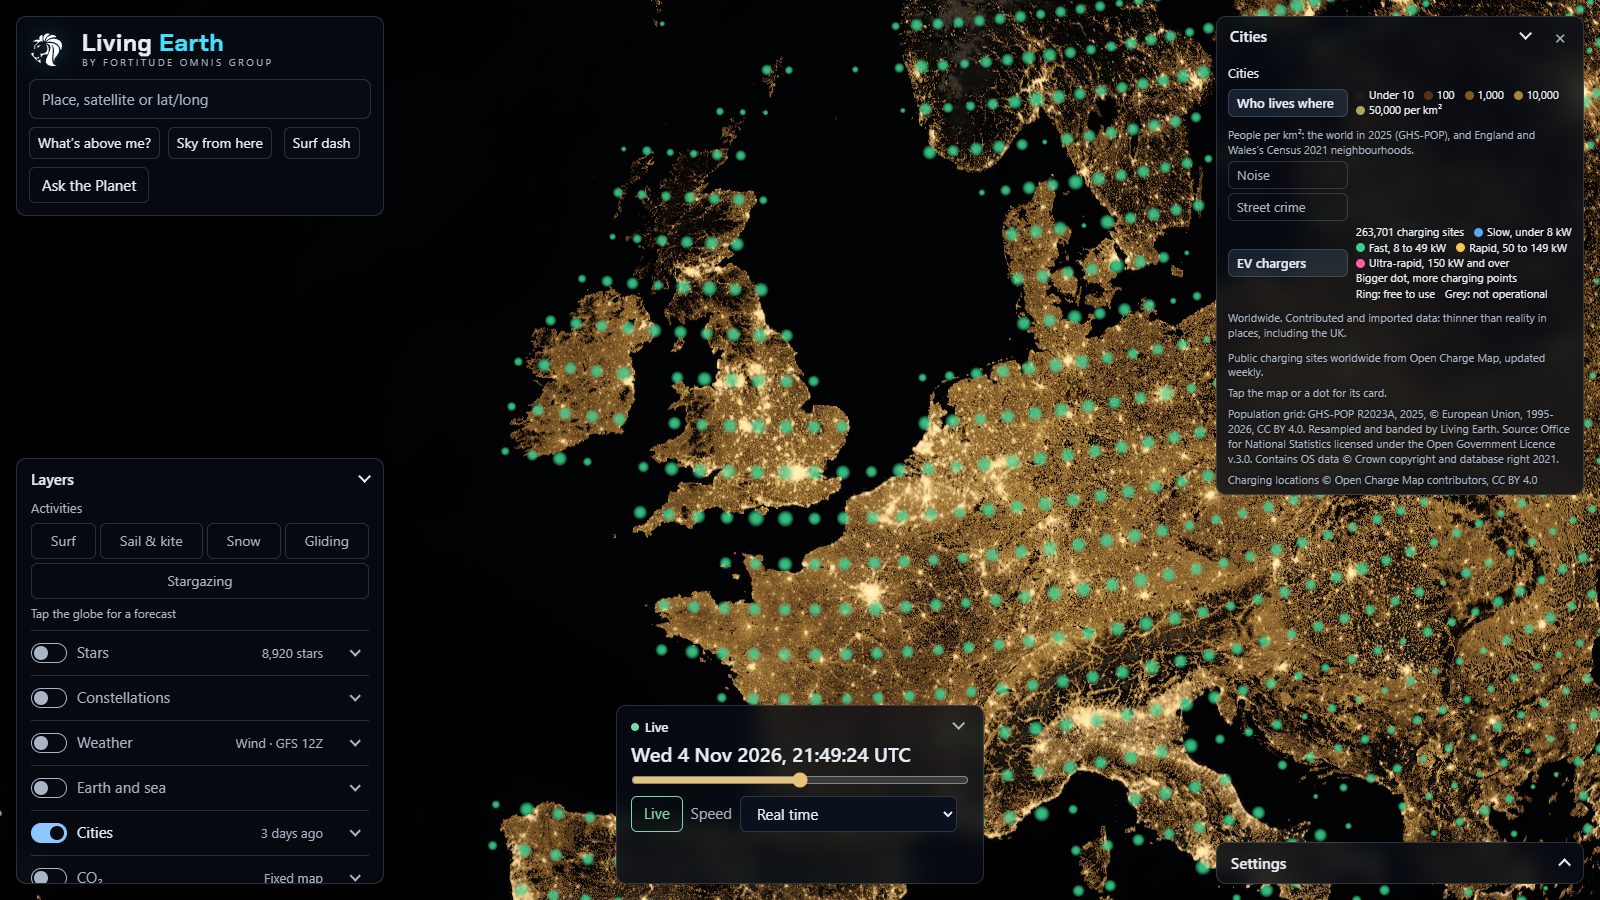
The Cities panel with Who lives where, Noise, Street crime and EV chargers, showing 263,701 charging sites in four speed classes
CITIES · EV CHARGERS ON

Cities

DAILY · WEEKLY

Four maps of how people live, close enough to pick out your own street.

Who lives wherePeople per km² for the whole world, then England and Wales's 35,672 census neighbourhoods as you zoom in.
NoiseDefra's modelled road and rail noise for England. Loudest, Road or Rail.
Street crime14 types, each with its own chip, for England, Wales and Northern Ireland.
EV chargers263,701 sites worldwide in four speeds, from slow to ultra-rapid. A ring means free to use.
Tap the mapA census card gives residents, people per km², households and homes with no car, then age, homes owned or rented, how people get to work, ethnic group and religion. A noise card puts the decibels in plain words ("like a busy street"). A crime card gives counts by type and a 12-month strip. A charger gives its operator, fastest charge, points, cost and connectors.
GHS-POP · ONS Census 2021 · Defra · data.police.uk · Open Charge Map
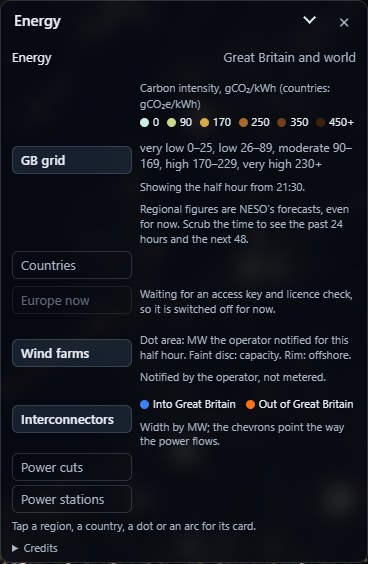
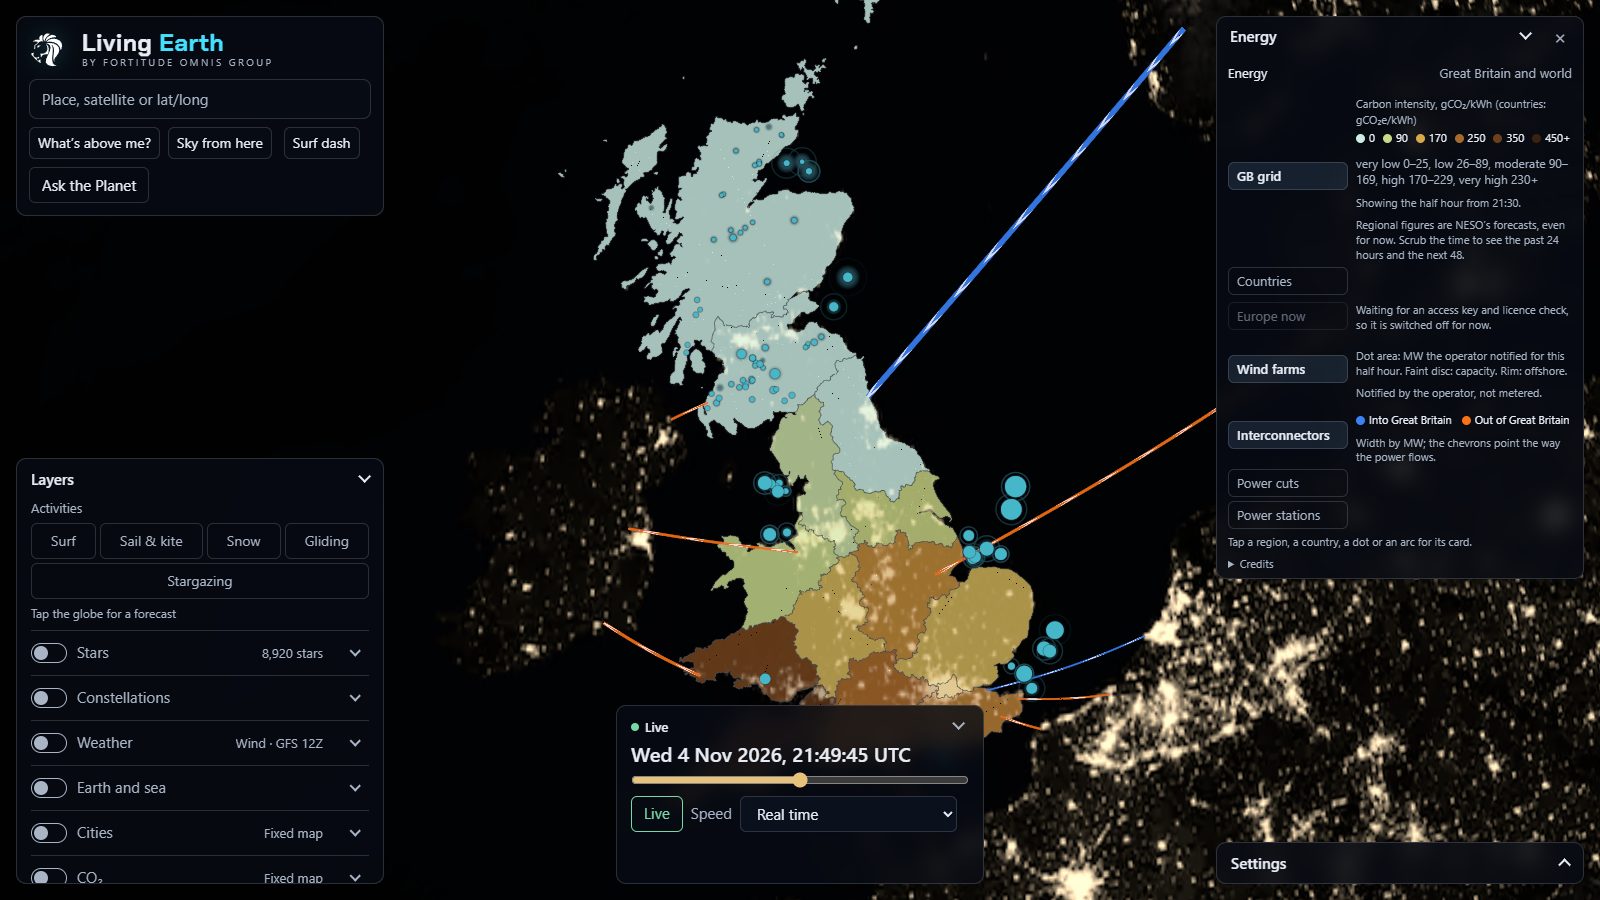
The Energy panel with GB grid, Countries, Europe now (switched off), Wind farms, Interconnectors, Power cuts and Power stations switches and their keys
ENERGY · GRID, WIND AND CABLES ON

Energy

EVERY 5 MIN

Great Britain's grid and the world's electricity, in seven switches.

GB grid14 regions tinted by grams of CO₂ per kWh, 24 hours back and 48 ahead.
Countries209 countries by CO₂ intensity or clean share.
Wind farms89 farms, 30 offshore, 22,102 MW. Dot area is this half hour's notified output.
Interconnectors9 cables, 9,300 MW. Chevrons point the way the power flows.
Power cutsUK Power Networks and SSEN, by postcode district only, and never under five customers.
Power stations10,701 of 50 MW and over, in ten fuels.
Tap a region, country, dot or arcA grid region gives its intensity and band, the generation mix for this half hour and a 72-hour chart with the greenest two hours ahead shaded. A wind farm gives output against capacity. A cable gives the flow now and which way. A country gives its mix and ten years of clean share.
NESO · Elexon BMRS · Ember · REPD · WRI · UKPN · SSEN · Europe now waits on ENTSO-E's key
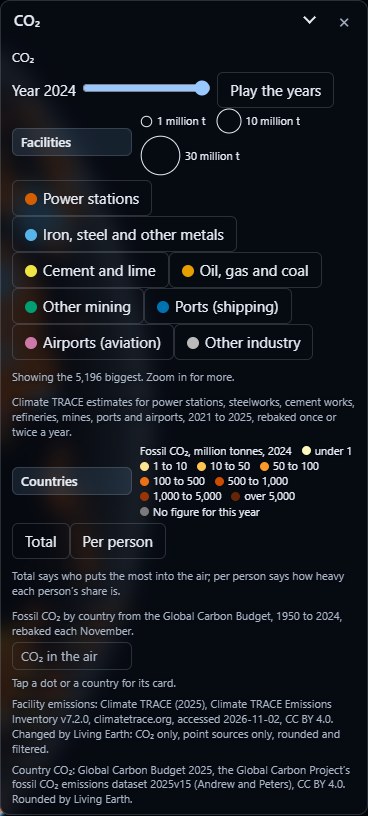
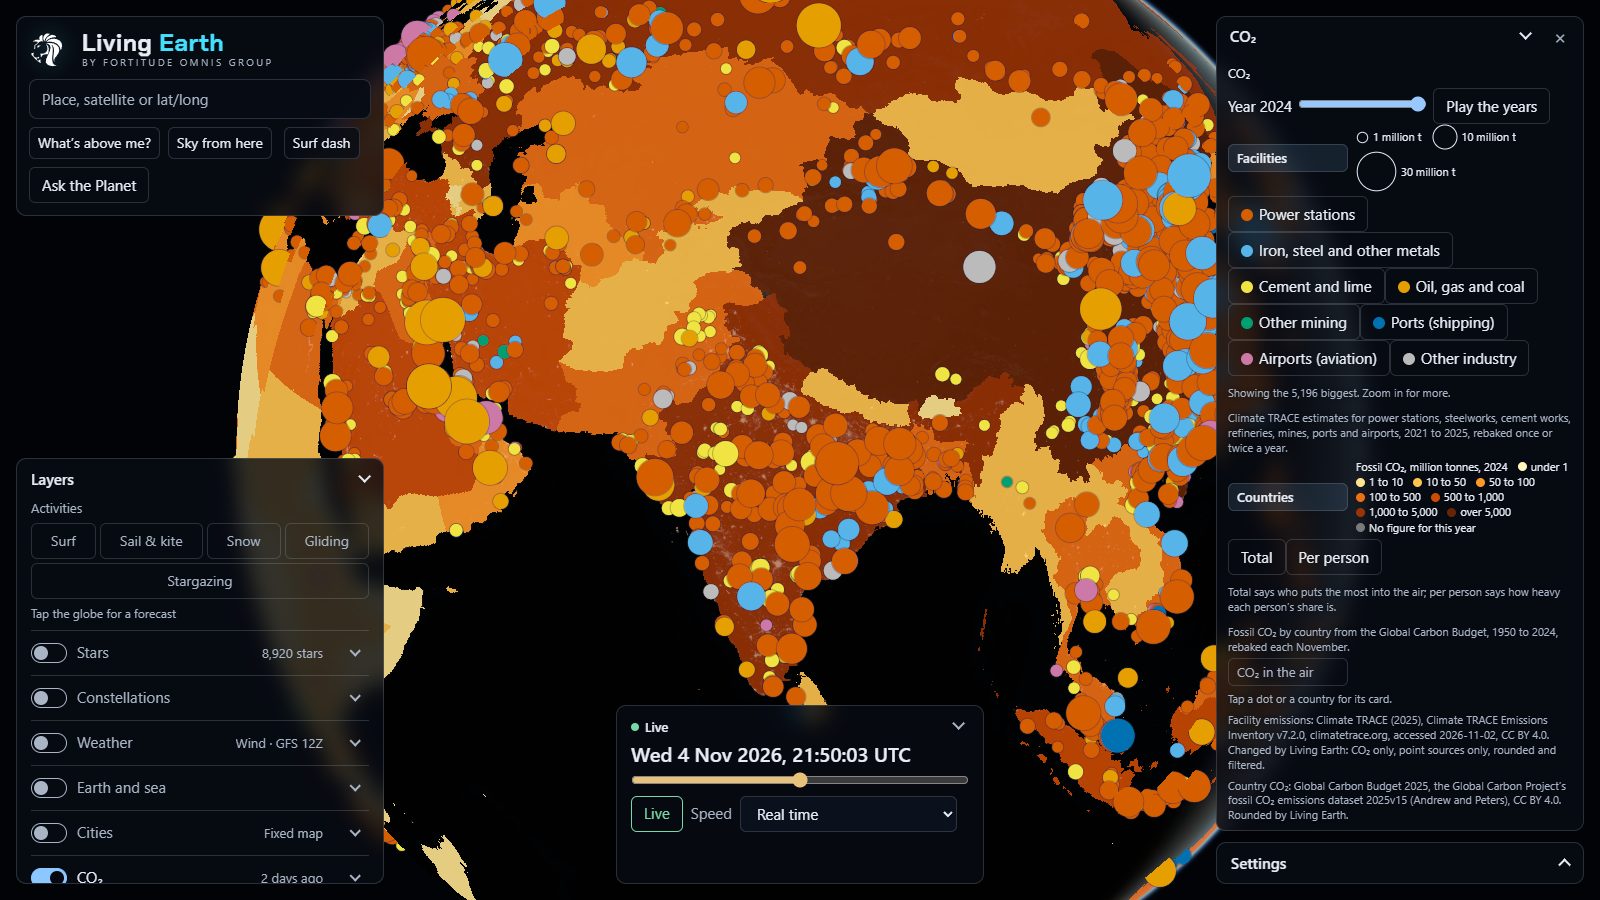
The CO2 panel with a year slider from 1950 to 2025 and a Play button, sector chips for facilities, and country totals or per-person keys
CO₂ · YEAR SLIDER AND SECTORS

CO₂

YEARLY · DAILY

A year slider from 1950 to 2025 with a Play button that runs it like a film, and three sections that follow it.

Facilities72,823 power stations, steelworks, cement works, refineries, mines, ports and airports, 2021 to 2025, with sector chips.
CountriesTotal or per person, every year back to 1950.
CO₂ in the airThe whole column of air against the planet's average, ±6 ppm, five days ahead.
Tap a dot, country or the airA facility says what it is in words, its CO₂ that year and a 2021 to 2025 strip. A country gives its total, per person, its rank both ways, its share of the world, the split by coal, oil, gas, cement and flaring, and a line back to 1950. The air gives the ppm over that spot and five days of it.
Climate TRACE · Global Carbon Budget 2025 · CAMS
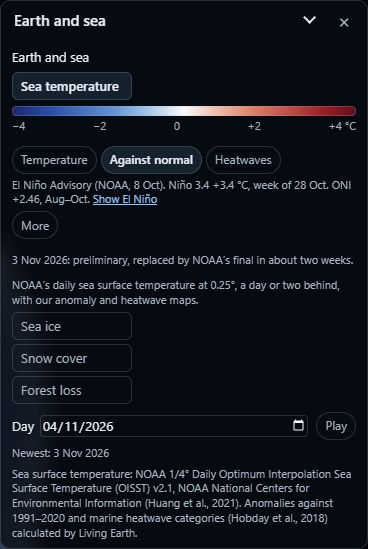
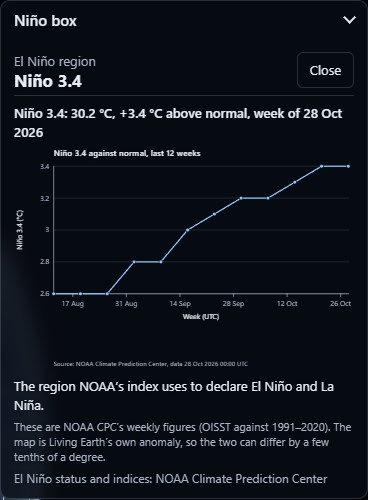
The Earth and sea panel: sea temperature with Temperature, Against normal and Heatwaves chips, the El Niño status line from NOAA, Sea ice, Snow cover and Forest loss switches and a day picker with Play The Niño 3.4 box card: 30.2 °C, 3.4 °C above normal for the week of 28 October 2026, with a chart of the last 12 weeks climbing from 2.6 to 3.4
EARTH AND SEA · AND THE NIÑO 3.4 BOX CARD

Earth and sea

DAILY

The sea, the ice, the snow and the forests, with a day picker and a Play button that steps through a day every quarter of a second.

Sea temperatureThree maps at 0.25°: the temperature, how far it is from normal for the date, and marine heatwaves from moderate to extreme.
El NiñoNOAA's status line word for word. More opens their synopsis and the Oceanic Niño Index since 1950, 921 seasons, the big peaks labelled.
Niño boxesThe four regions NOAA watches, outlined on the globe, Niño 3.4 brightest.
Sea ice and snowBoth poles, with the extent against the 1981 to 2010 average, and the northern snow cover.
Forest lossWhere the trees went, 2001 to 2025, with its own year slider.
Tap inside a Niño boxThis week's temperature and how far above normal it is, the last 12 weeks as a chart, and what that box is for. Niño 3.4 is "the region NOAA's index uses to declare El Niño and La Niña". On the night it read +3.4 °C.
NOAA OISST v2.1 · NOAA CPC · NSIDC · NOAA/USNIC IMS · Hansen/UMD Global Forest Change
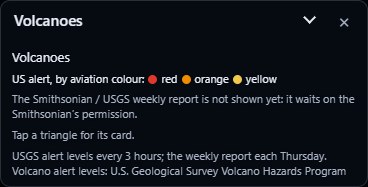
The Volcanoes panel: US alerts by aviation colour, red, orange and yellow, and a note that the Smithsonian weekly report waits on permission
VOLCANOES · USGS ALERTS

Volcanoes

EVERY 3 H

US volcanoes at a raised USGS alert level, as triangles in their aviation colours. That night it was one orange triangle out in the Aleutians. The Smithsonian's weekly worldwide report is built and waits on their written permission.

Tap a triangleName and status, the USGS alert and aviation colour with a link to the notice, the type of volcano, its height and its last known eruption. And when an earthquake lands near one, the quake's card gets a Volcano row.
USGS Volcano Hazards Program

And 13 layers with no panel at all

ONE SWITCH EACH

These just need a switch. Each row in the layer drawer cycles through its count, how old the data is and what it covers, and says "Running late" or "Not updating" the moment a feed misbehaves.

SatellitesDebrisEarthquakes · 193Wildfires · 59,853LightningAurora · KpSatellite cloudsStars · 8,920Constellations · 88BordersLatitude and longitudeTime zonesPlace names
Tap a satelliteAltitude, speed, NORAD number and designator, then what it is, its family, its launch ("the 67th launch of 1998"), its orbit, how long it takes to go round and its inclination.
Tap an earthquakeMagnitude, depth and time, with the strength and depth in plain words, and the reminder that each whole step is about 32 times the energy.
Tap a fireWhen it was seen, how much heat it's giving off in megawatts, and how sure the satellite is.
New in this release

Four new layers, El Niño, and what's in the water.

Energy, CO₂, Earth and sea and Volcanoes take the globe from 23 layers to 27. El Niño joins the sea, the sewage and plankton lines join the surf, and Scotland's rivers join England's. Some of the feeds behind it are still waiting on a key or a yes from the people who run them, so each one says where it's at. No pretending.

Energy

Great Britain's gridHALF HOURLY

The 14 grid regions tinted by how much CO₂ a kilowatt-hour costs right now, the mix behind it, and the greenest window in the next 48 hours marked. So you know when to run the dishwasher.

NESO Carbon Intensity API
Wind farms and interconnectorsHALF HOURLY

89 wind farms (30 of them offshore, 22,102 MW between them) sized by the output their operators have notified for this half hour, and the nine cables to our neighbours, 9,300 MW in all, drawn as arcs, thicker for more megawatts, with chevrons for which way the power's going.

Elexon BMRS · DESNZ Renewable Energy Planning Database
Countries and power stationsYEARLY

About 210 countries by the carbon in their electricity or their clean share, with ten years of it as a chart, and every power station of 50 MW and over worldwide, coloured by fuel.

Ember · WRI Global Power Plant Database
Power cutsLIVE

Outages by postcode district (never a full postcode), sized by the customers off, with the operator's own update. Two of Britain's six network operators so far, UK Power Networks and SSEN. Electricity North West is built and waits on its key.

UKPN · SSEN Distribution
Europe nowWAITING ON FEED

Each European country by the low-carbon share of its last hour. Ready to go the day ENTSO-E sends our access token.

ENTSO-E Transparency Platform

CO₂

FacilitiesYEARLY

A dot for every power station, steelworks, cement works, refinery, mine, port and airport, sized by the CO₂ it put out. The biggest power station in 2025? Vindhyachal in India: 4,760 MW of coal and 33.4 million tonnes of CO₂.

Climate TRACE
CountriesYEARLY

Every country by its total CO₂ or per person, with its rank, its share of the world and the split by coal, oil, gas and cement. A year slider with a play button runs it like a film.

Global Carbon Project, Global Carbon Budget 2025
CO₂ in the air5-DAY FORECAST

The CO₂ in the whole column of air above every point, against the planet's average, scrubbing five days ahead just like the weather maps.

Copernicus Atmosphere Monitoring Service

Earth and sea

Sea temperature and heatwavesDAILY

The sea's temperature, how far it is from normal for the date, and marine heatwaves by category. The surf card says it in words too: the water temperature, and whether it's warmer or colder than it should be.

NOAA OISST v2.1
El Niño, in NOAA's own wordsWEEKLY

NOAA's status line word for word, the weekly Niño 3.4 figure, and the Oceanic Niño Index back to 1950 as a chart of 921 seasons. The four Niño boxes sit on the globe, and tapping one gives its last 12 weeks. Right now? An El Niño Advisory, with Niño 3.4 at +3.4 °C. We never grade it ourselves.

NOAA Climate Prediction Center
Sea ice and snowDAILY

Ice at both poles and the northern snow cover, day by day, with the yearly lows and highs since 1979 to step through.

NSIDC Sea Ice Index v4 · NOAA/USNIC IMS
Forest lossYEARLY

Where the world's tree cover went, year by year from 2001 to 2025, from the 30 m Hansen maps.

Hansen / UMD / Google / USGS / NASA Global Forest Change
VolcanoesUSGS EVERY 3 H

US volcanoes at a raised USGS alert level, as triangles in their aviation red, orange or yellow. The Smithsonian's weekly worldwide report is built and joins the day they give us written permission. And an earthquake near a watched volcano says so on its card.

Smithsonian Global Volcanism Program · USGS Volcano Hazards Program

Trains, and what's in the water

Every National Rail trainBUILT · NOT SWITCHED ON

Every train on Network Rail's lines in England, Scotland and Wales, 3,000+ at a weekday peak, coloured by how late it is. Tap one for where it's going, where it is and how many minutes behind.

Network Rail Open Data · NaPTAN
Sewage overflows15 MIN

417 of South West Water's storm overflows sit in the Cornish surf box. If one near your break is spilling now, the card says so and the overflow pulses amber on the globe. There's no green tick, because a quiet monitor isn't the same thing as clean water.

South West Water (CC BY 4.0)
Plankton bloomsDAILY

Satellite chlorophyll at 1 km, against the usual for that month in that spot. A bloom shows as a green tint off the coast and a line on the surf card.

Copernicus Marine ocean colour
Scotland on the Water layer15 MIN

SEPA's 394 river gauges and Scotland's bathing waters join England's. Scottish flood warnings are coded and wait on SEPA's say-so, and Wales follows as soon as Natural Resources Wales issues our key.

SEPA (OGL) · Natural Resources Wales
Our own ears on the sky

We don't just borrow the planes. We listen for them.

Plenty of map sites just pull someone else's feed. Ask the Earth has its own antenna. A software-defined radio tuned to 1090 MHz sits on the same Raspberry Pi 5 that runs the rest of the planet, decoding the ADS-B messages every passing aircraft broadcasts: position, height, speed, callsign. Those messages go straight into the adsb.lol community network, and feeding the network is what opens up its worldwide feed to us. Every plane on the globe is a two-way deal.

29.0Mmessages decoded since it switched on, 23 Oct 2026
1.34Maircraft positions worked out
12,157aircraft tracks heard
~3,000messages a minute, even at midnight
readsb stats on the Pi, 23 Oct 20:20 UTC to 26 Oct 23:25 UTC · RTL-SDR · readsb 3.14
Two ways to run it

Leave it alone and it puts on a show.

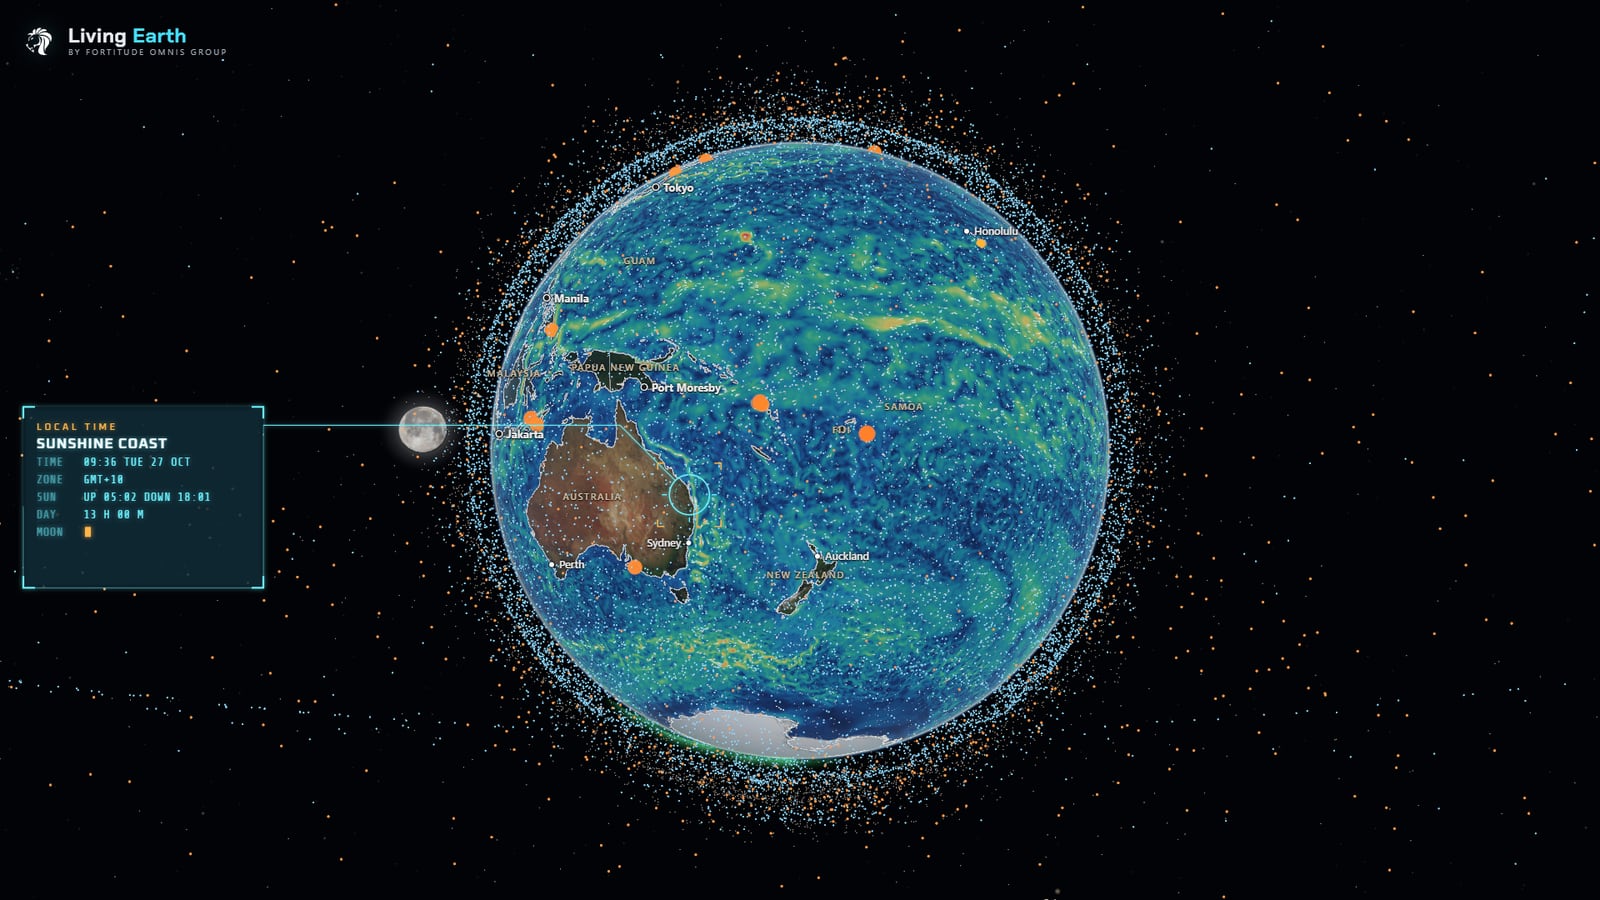
Both screenshots were taken from the live site on 26 October 2026. No mock-ups, no staged data.

Demo mode with the ocean currents layer over the Pacific, the nearly full Moon beside the Earth, and a local-time callout for the Sunshine Coast, Australia: 09:36 Tuesday, sunrise 05:02, sunset 18:01
DEMO MODE · OCEAN CURRENTS · THE MOON IN ITS TRUE PLACE · LIVE SITE · 27 OCT 2026
Demo mode

Twenty seconds idle, and it starts hunting.

Walk away and the globe locks on to things by itself: a satellite with its NORAD number, height and speed, the latest quake, the busiest storm, the hottest and coldest places in view. Touch anything and it hands straight back.

And it's not a painted backdrop. The Sun and the Moon sit exactly where they really are at that moment, worked out from Meeus's lunar theory, and the Moon wears NASA's real surface map, turned the way it really faces us.

  • Target locks with real orbital data, 10 seconds each
  • Weather boxes with what to wear, sunrise and sunset
  • Perfect for a lobby screen, a classroom or a shop window
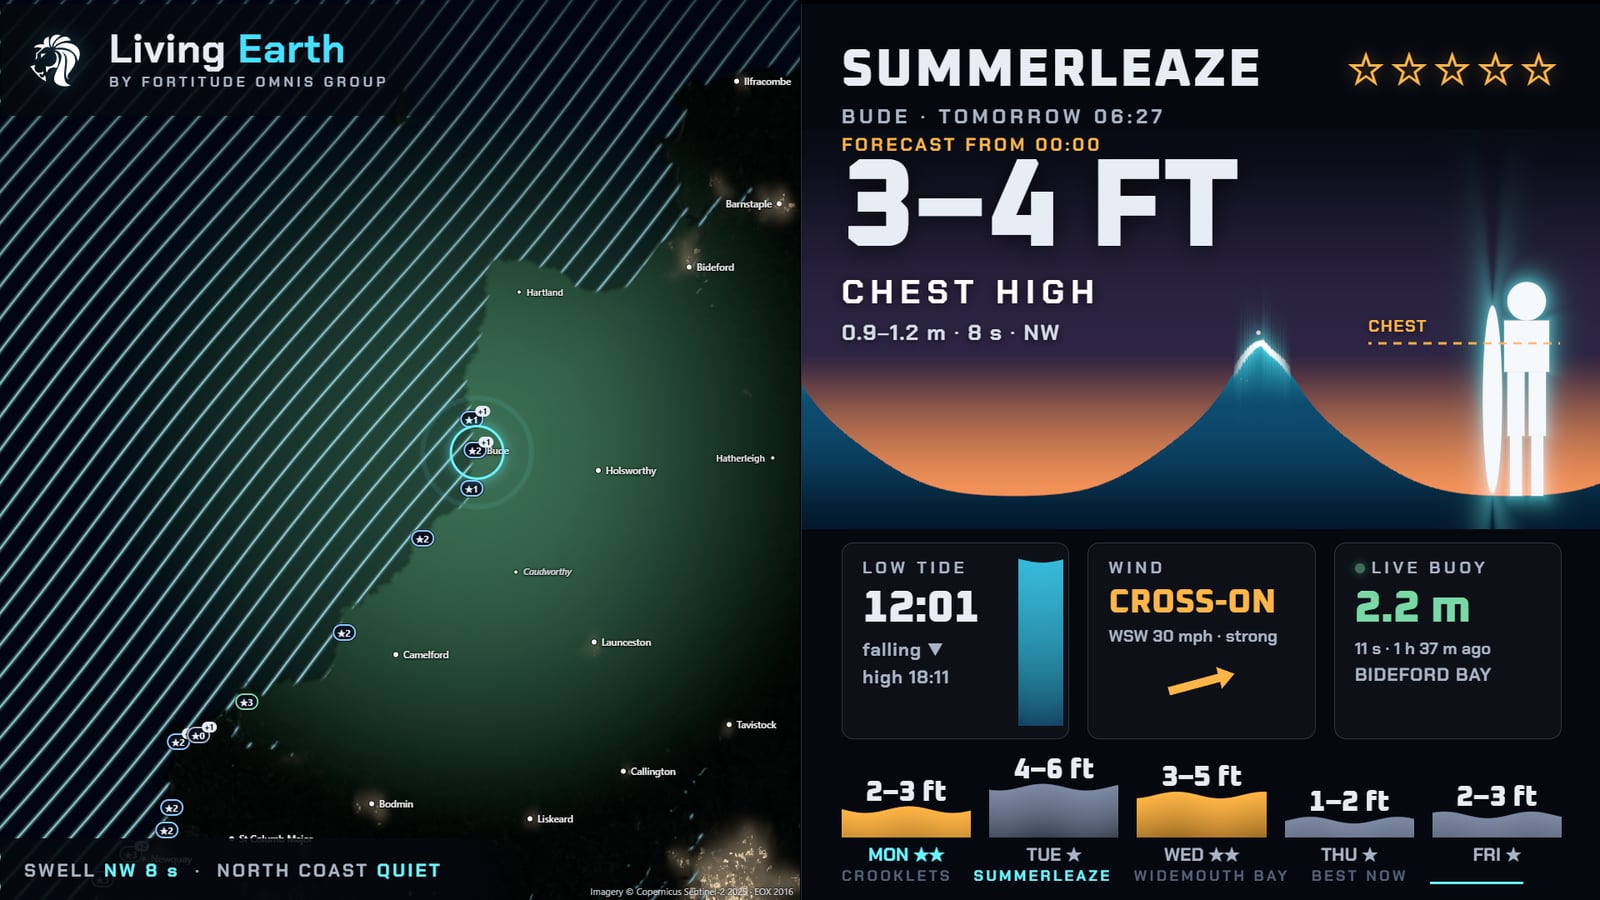
The surf shop screen for Summerleaze, Bude: 3 to 4 feet, chest high, with swell lines over north Cornwall on the left, and the tide, wind, the live Bideford Bay buoy and a five-day outlook on the right
SURF SHOP SCREEN · LIVE SITE · /?shop=crooklets,summerleaze,widemouth-bay
Surf shop screen

A free forecast board for any surf shop.

One link turns a TV into a forecast board. It laps through the shop's own breaks, 12 seconds each, then shows the best of Cornwall right now. The wave is drawn against a 1.71 m surfer, so "6–8 ft" actually means something.

  • Wave height in feet and in plain words: knee, waist, head high, overhead
  • Tide, wind and the nearest live wave buoy
  • Five-day outlook, refreshed every 30 minutes
The 5-day forecast

Tap anywhere on Earth. Get the next five days.

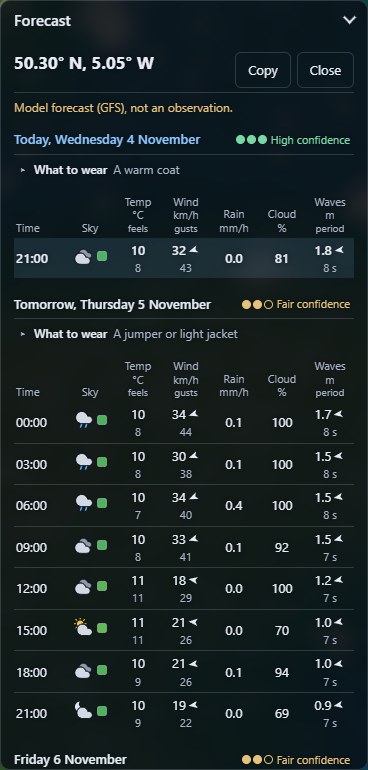
Switch the weather on, tap the ground, and a forecast card opens for exactly that spot: every three hours for five days, grouped by local day. Then lay any of 18 forecast maps over the whole planet and scrub through time to watch it happen.

Ask the Earth's 5-day forecast card for 50.30° N, 5.05° W in Cornwall: three-hourly rows of sky, temperature and feels-like, wind and gusts, rain, cloud and waves, a three-pip confidence badge for each day and a what-to-wear line, a warm coat tonight and a jumper or light jacket tomorrow
FORECAST CARD · 50.30°N 5.05°W, CORNWALL · LIVE SITE · 4 NOV 2026
  • Every 3 hours, for 5 days. Sky, temperature and feels-like, wind and gusts with direction, rain, cloud cover, and waves with their period.
  • A confidence rating for each day. We compare the latest run with the runs from 6, 12 and 18 hours before. When the models keep changing their minds, the card says so.
  • What to wear. A plain answer, worked out from the numbers. No guessing.
  • Five activity modes. Surf, sail and kite, snow, gliding and stargazing each swap in the rows that matter, from swell periods to cloud base to sky darkness.
18 forecast maps, all free
WindGustsTemperatureFeels likeRain + snowCloudsPressure + isobarsCAPEHumiditySnow depthFreezing levelBoundary layerWavesSwellSecond swellWind seaSea tempCurrents
FeatureAsk the EarthWeatherPro
Live lightning mapFreePremium
IsobarsFreePremium
Wind animation over the globeFree, 65,536 particlesNot listed
Swell, currents, CAPE, snow depthFreeNot listed
Day-by-day confidenceFreeNot listed
Forecast length5 days, 3-hourly14 days hourly (Premium)
Price£0£8.99 a year
Forecast data: NOAA GFS 0.5°, refreshed with every model run. WeatherPro features from its UK App Store listing, 26 Oct 2026.
Plans

The globe's free. The extras aren't.

Every layer, every panel and Ask the Planet stay free, for good. Plans add more questions, more saved places, and the part where Ask the Earth keeps an eye on your places for you. These prices come straight from checkout, so they can't disagree with it.

Free

£0no account needed
  • Everything on the globe, all 27 layers
  • Ask the Planet: 5 questions a day signed out, 10 with a free account
  • 5 saved places and 5 saved views
  • Your chats saved, so you can carry on from any device

Explorer

£4a monthor £36 a year3 months free yearly
  • 50 questions a day
  • 25 saved places and 50 saved views
  • Alerts for your places
  • A daily digest and a weekly briefing
Start 7-day free trial No card. It just stops. Or buy it now.

Founding supporter

£49onceExplorer for as long as Ask the Earth runs, plus a badge
  • Everything in Explorer
  • Only 50 places, ever
  • Pay once, never again

50 of 50 left

All 50 taken – thank you

Become a founder

Question pack

£5for 300 questions
  • Never expire, and packs add up
  • Any plan, free included
  • Only used once the day's allowance runs out

Place report

£9onceA 15-page report on one postcode, England only
  • 16 checks on one postcode, from flooding and sewage to schools, GPs and house prices
  • Official sources only, every one named, nothing made nicer
  • See what it covers before you pay, and get it all back if we can't make it
  • Prices in pounds. No VAT added (we're not VAT registered).
  • Who can buy: the UK, the US, Australia, New Zealand, Switzerland, Singapore, and EU businesses with a VAT number. EU consumers: coming soon.
  • Cancel any time from the account panel. Nothing is deleted when a plan ends.
  • Coming: Pro (API, exports, free place reports) and embeds for business.

Plans open soon.

The globe's free in the meantime, all 27 layers and Ask the Planet included. Nothing to sign up for.

Open the globe
Place reports · £9

What the estate agent's brochure leaves out.

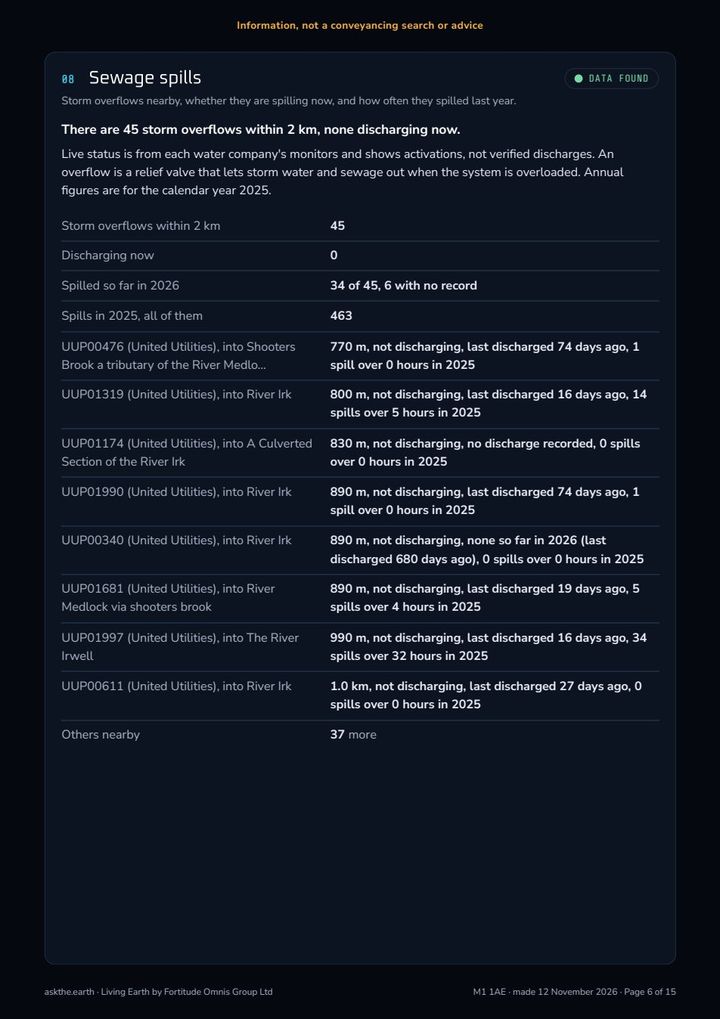
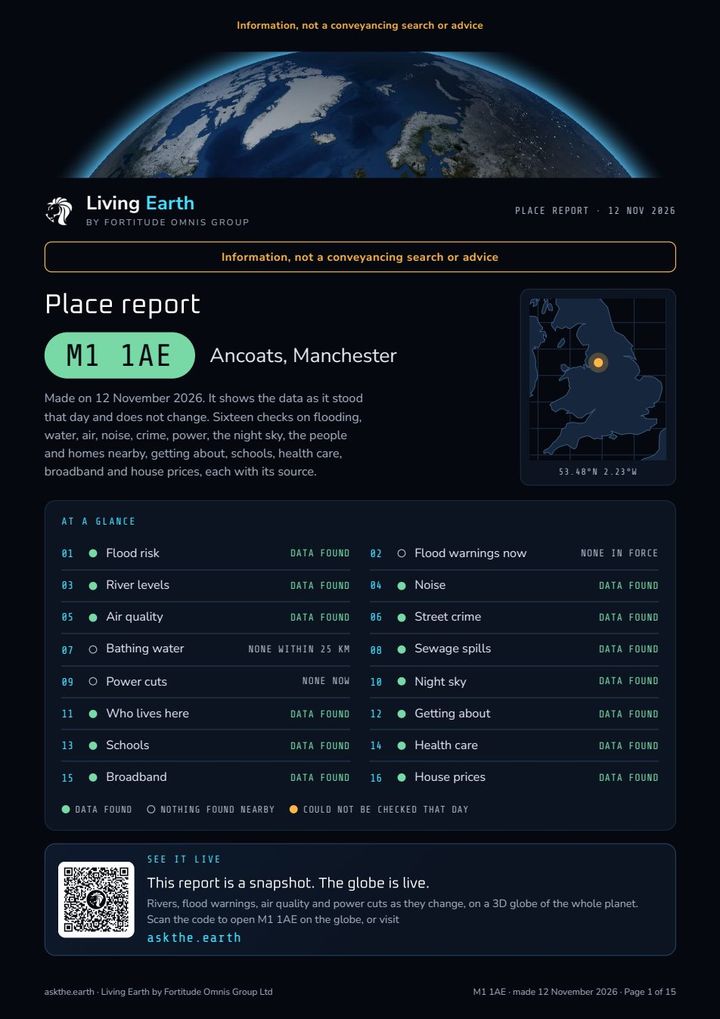
An estate agent is paid to sell you the place. Nobody pays us to like it. Give us a postcode in England and you get 16 checks from public data (flooding, sewage, noise, crime, air, schools, GPs, broadband, house prices and the rest), each one with where it came from. £9, once.

From the sample: M1 1AE, Ancoats, Manchester
  • 45 storm overflows within 2 km. Between them, 463 spills in 2025.
  • Road noise modelled at 70 to 74 dB, averaged over day and night.
  • No home at the postcode can get gigabit broadband yet.
  • Nearest primary school 380 m, nearest major A&E 2.3 km.

Would the listing have mentioned any of that? Nope. It had a lovely photo of the kitchen though.

Who it's for

  • Buying a home, before you make the offer, not after
  • Renting somewhere you've never lived
  • Two areas and you can't pick between them
  • Checking out where family are moving to

How it works

  • Type the postcode. Before you pay, it shows which of the 16 checks have data there.
  • Ready in a few minutes and emailed to you. A 15-page PDF to keep, dark or printer-friendly.
  • If we can't make it, you get the £9 back. All of it.
  • England only for now. Ordering needs a free account.
£9per postcode, once

Ordering opens on askthe.earth soon. The sample's all yours right now.

Order a report Sign in, open your account, then Place reports.

Official data. No opinions.

Every figure comes straight from the body that publishes it, with its source and licence printed beside it. (Bar one: how dark the night sky gets is our own estimate from NASA's satellite night lights, and the report says that too.) We don't grade a street, spin a number or round it to sound nicer. Where a source is patchy, the report SAYS so (Greater Manchester Police's crime data, in the sample).

Environment AgencyDefraOffice for National StatisticsHM Land RegistryOfstedDepartment for EducationNHS EnglandOfcomdata.police.ukWater UKOffice of Rail and RoadOrdnance SurveyPower network operators

Information, not a conveyancing search or advice. Your solicitor still does the searches. This is what you read before you ring them.

Page 1 of the sample place report for M1 1AE in Ancoats, Manchester: 16 checks at a glance, from flood risk to house prices
The comparison

Everything they charge for, free. Plus the one thing none of them do.

We priced the apps people actually use for each kind of data, from their own pricing pages and the UK App Store on 26 October 2026. Each one is very good at its one thing. None of them does the rest.

Ask the Earth £0

Every layer, every panel, no account, nothing to install. Open a link and it's running.

The specialist stack ~£146 a year
FlightRadar24 Gold£33.99
Surfline Premium£34.99*
MarineTraffic Mobile Pro£29.99*
Windy Premium£22.99
Ventusky Premium£14.99
WeatherPro Premium£8.99

*Billing period not stated on the UK listing. Even with all six you still get no UK rivers, floods, buses, tube or EV chargers.

Ask the Earth Explorer £36 a year

Everything above, plus alerts for your own places.

See plans
What you get Ask the Earth FlightRadar24 WeatherPro Windy MarineTraffic Surfline Google Earth
Live aircraftFREEFREE + PAID—————
Satellites and debrisFREE——————
EarthquakesFREE——————
LightningFREE—PAIDLISTED———
Weather maps and windFREECLOUD: GOLDFREE + PAIDFREE + PAIDFREE + PAIDWIND—
Ocean currentsFREE——LISTED———
Surf forecastFREE · CORNWALL——WAVES—FREE + PAID—
ShipsFREE · BALTIC———FREE + PAID——
Air qualityFREE——LISTED———
UK rivers and floodsFREE——————
Buses, tube and tramsFREE——————
3D globeFREE3 FREE SESSIONS————FREE
Price a year£0£0–£33.99£0–£8.99£0–£22.99£0–£29.99*£0–£34.99*£0 · Pro $900/user
FREE free to everyone FREE + PAID basics free, extras paid PAID paid tier only LISTED on its feature list, tier not stated — not on its own feature or pricing pages
Under the hood

No game engine. No globe library. Written from the metal up.

We're boiling the ocean here, on purpose. Ask the Earth is hand-written TypeScript and WebGPU with just five runtime dependencies, and three of those are only there for passkey sign-in and QR codes. Here's what it takes to put 29,000 satellites, 10,000 planes and a live weather model on a phone at close to 60 frames a second.

Orbital mechanics on the GPU

The full SGP4/SDP4 model for every object, every frame

The standard satellite model, deep-space resonance terms and all, ported line for line to a compute shader. WGSL has no 64-bit floats, so we emulate them: each hot term is two 32-bit floats (about 48 bits), with our own branch-free sine, cosine and arctangent. One dispatch a frame, no allocation.

Error vs the f64 reference, 29,093 objectsMedianp99WorstWorst at +7 days
Emulated double (df64)2 m20 m104 m132 m
Plain f3222 m499 m3.1 km4.5 km
A satellite moves 7.6 km every second. A 2 m median error is the width of a car.
Frame rate
59.9fps

Median with one million moving points at 3828 × 1923, and not one of 3,600 frames dropped. The GPU pass took 2.88 ms of the 16.7 ms budget.

GPU median2.88 ms
GPU p954.78 ms
Frame budget16.7 ms
Desktop, NVIDIA Ampere
On a phone
58.8fps

On an iPhone 16 Pro Max at full resolution (1320 × 2268), 1 dropped frame in 3,240. A repeat run matched.

iPhone 16 Pro Max · first-release load of 85,000 points
Tap to pick
29ms

Median time to work out what you tapped on a phone, among a million points. Every shader writes its object's id to a hidden buffer in the same pass, and we read back a tiny square under your finger without ever stalling a frame. 200 taps out of 200 found their object.

iPhone · p95 30 ms · max 40 ms
Weather particles
65,536

Wind, current and wave particles, each with a 24-point trail, advected on the GPU and killed at the coastline by a mask. The count scales to your screen, one per 90 square pixels.

One compute invocation per particle, branch-free
Wire formats

25 custom file formats, byte-for-byte lean

Every feed is turned into a purpose-built binary format before it leaves the ingest host. Files are named by their SHA-256, so nothing is ever sent twice.

LEACaircraft16 B each
LELTlightning14 B a flash
LESHships24 B each
LEEQearthquakes26 B + text
LESBstars6 B each
LEAV 2buses, columnar varint54% smaller
Decoders from scratch

GRIB2, JPEG 2000 and HDF5, in plain TypeScript

Weather models arrive as GRIB, satellite imagery as JPEG 2000 and HDF5. Instead of shipping native libraries, we wrote the decoders. Our GRIB2 decoder matches ECMWF's ecCodes on every point to within 0.000015.

DecoderLines
HDF5987
JPEG 2000701
GRIB2403
GRIB1325
The pipeline

A Raspberry Pi runs the whole planet

Sources60+ feedsNOAA, USGS, EUMETSAT, CelesTrak, the Environment Agency, TfL, DfT and the rest
IngestRaspberry Pi 530+ systemd jobs, from every minute to weekly, plus its own ADS-B radio receiver
StoreCloudflare R2~30,000 uploads a day, inside the free 1M a month
ServePages + WorkersEdge functions and cron jobs for quakes and aurora, on the free plan
DrawYour GPUWebGPU compute and 51 hand-written shader files, right in your browser
The craft, in numbers
27live data layers on one globe
2,009commits
497,955lines of TypeScript
7,311lines of WGSL shader code
15,799unit tests
356end-to-end browser tests on a real GPU
5runtime dependencies. Two do the maths for the sky, two do passkeys, one draws QR codes.
£0a month to host, by design

COUNTED FROM THE REPOSITORY · 16 NOV 2026 · COMMIT 9477C332

Fortitude Omnis Group

Your data. On a living globe.

Ask the Earth is a tech showcase. It's what happens when we point our engine at the whole planet's open data and don't stop. Imagine it pointed at your data instead: your sensors, your sites, your customers, your readings, live on a 3D globe in any modern browser, with no plug-ins, no game engine and no per-seat licence.

Talk to us fortitude-omnis.group Or see it running right now: askthe.earth
Questions

The things people ask.

Is Ask the Earth free?

Yes. The Ask the Earth globe is free for everyone: all 27 live layers, every panel, the 5-day forecast and Ask the Planet, with no account, no app and no ads. You get 5 questions a day to Ask the Planet without signing in. A free account gives you 10 a day and saves 5 places and 5 views. Paying only adds extras on top.

What does Explorer add, and what does it cost?

Ask the Earth Explorer costs £4 a month or £36 a year (3 months free if you go yearly). It watches your saved places and sends an alert to your phone when something happens there, from a quake nearby to a good surf window, plus a daily digest email and a weekly briefing. You also get 50 questions a day, 25 saved places and 50 saved views.

Is there a free trial? Do I need a card?

Yes, Ask the Earth Explorer has a 7-day free trial, and no, you don't need a card to start it. It just stops at the end, so there's nothing to cancel and no surprise charge. It's one trial per email address.

What is the founding supporter deal?

You pay £49 once and get Ask the Earth Explorer for as long as Ask the Earth runs, plus a founder's badge. There are only 50 places, ever, and 50 are left. It ends if you delete your account, or if Ask the Earth ever closes for good, with 30 days' notice first.

Can I cancel? What happens to my saved places?

You can cancel Ask the Earth Explorer any time from the account panel, and you keep it to the end of what you've paid for. Nothing is deleted when a plan ends. Places and views over the free limits stay and still work, and your alerts pause until you pick Explorer again.

Does it work on iPhone and Android?

Yes. Ask the Earth runs in the browser on iPhone, Android, Mac, Windows and Linux, with nothing to install. It needs a browser with WebGPU, which current Chrome, Edge and Safari all have. For alerts on an iPhone or iPad, add Ask the Earth to your Home Screen first, because that's the only way Safari allows notifications.

Do you track me or show ads?

No. Ask the Earth shows no ads and sets no tracking cookies. The globe counts visits with Cloudflare's cookie-free page counter and nothing else. Ask the Planet sends your question to Anthropic's Claude to be answered and Ask the Earth keeps nothing once it's done. Payments happen on Stripe's own page, so we never see your card number.

Which countries can buy?

Ask the Earth plans can be bought from the UK, the US, Australia, New Zealand, Switzerland, Singapore, and EU businesses with a VAT number. EU consumers: coming soon. The free globe works everywhere.

Where does the data come from, and how fresh is it?

Ask the Earth reads 60+ open data feeds from the people who collect it, including NOAA, USGS, NASA, EUMETSAT, CelesTrak, the Environment Agency and TfL. Each layer refreshes on its own clock: planes, buses and trains every 30 seconds, earthquakes and lightning every minute, and the weather with every model run. Every layer, and every answer from Ask the Planet, names its source.

Can I put Ask the Earth on my own screen or website?

On a screen, yes, today. Ask the Earth's surf shop screen is a free link that turns any TV into a forecast board, and demo mode puts on a hands-off show for a lobby or a classroom. Embeds for your own website aren't ready yet. For your own data on the globe, or anything bespoke, talk to us.